Fig. 2
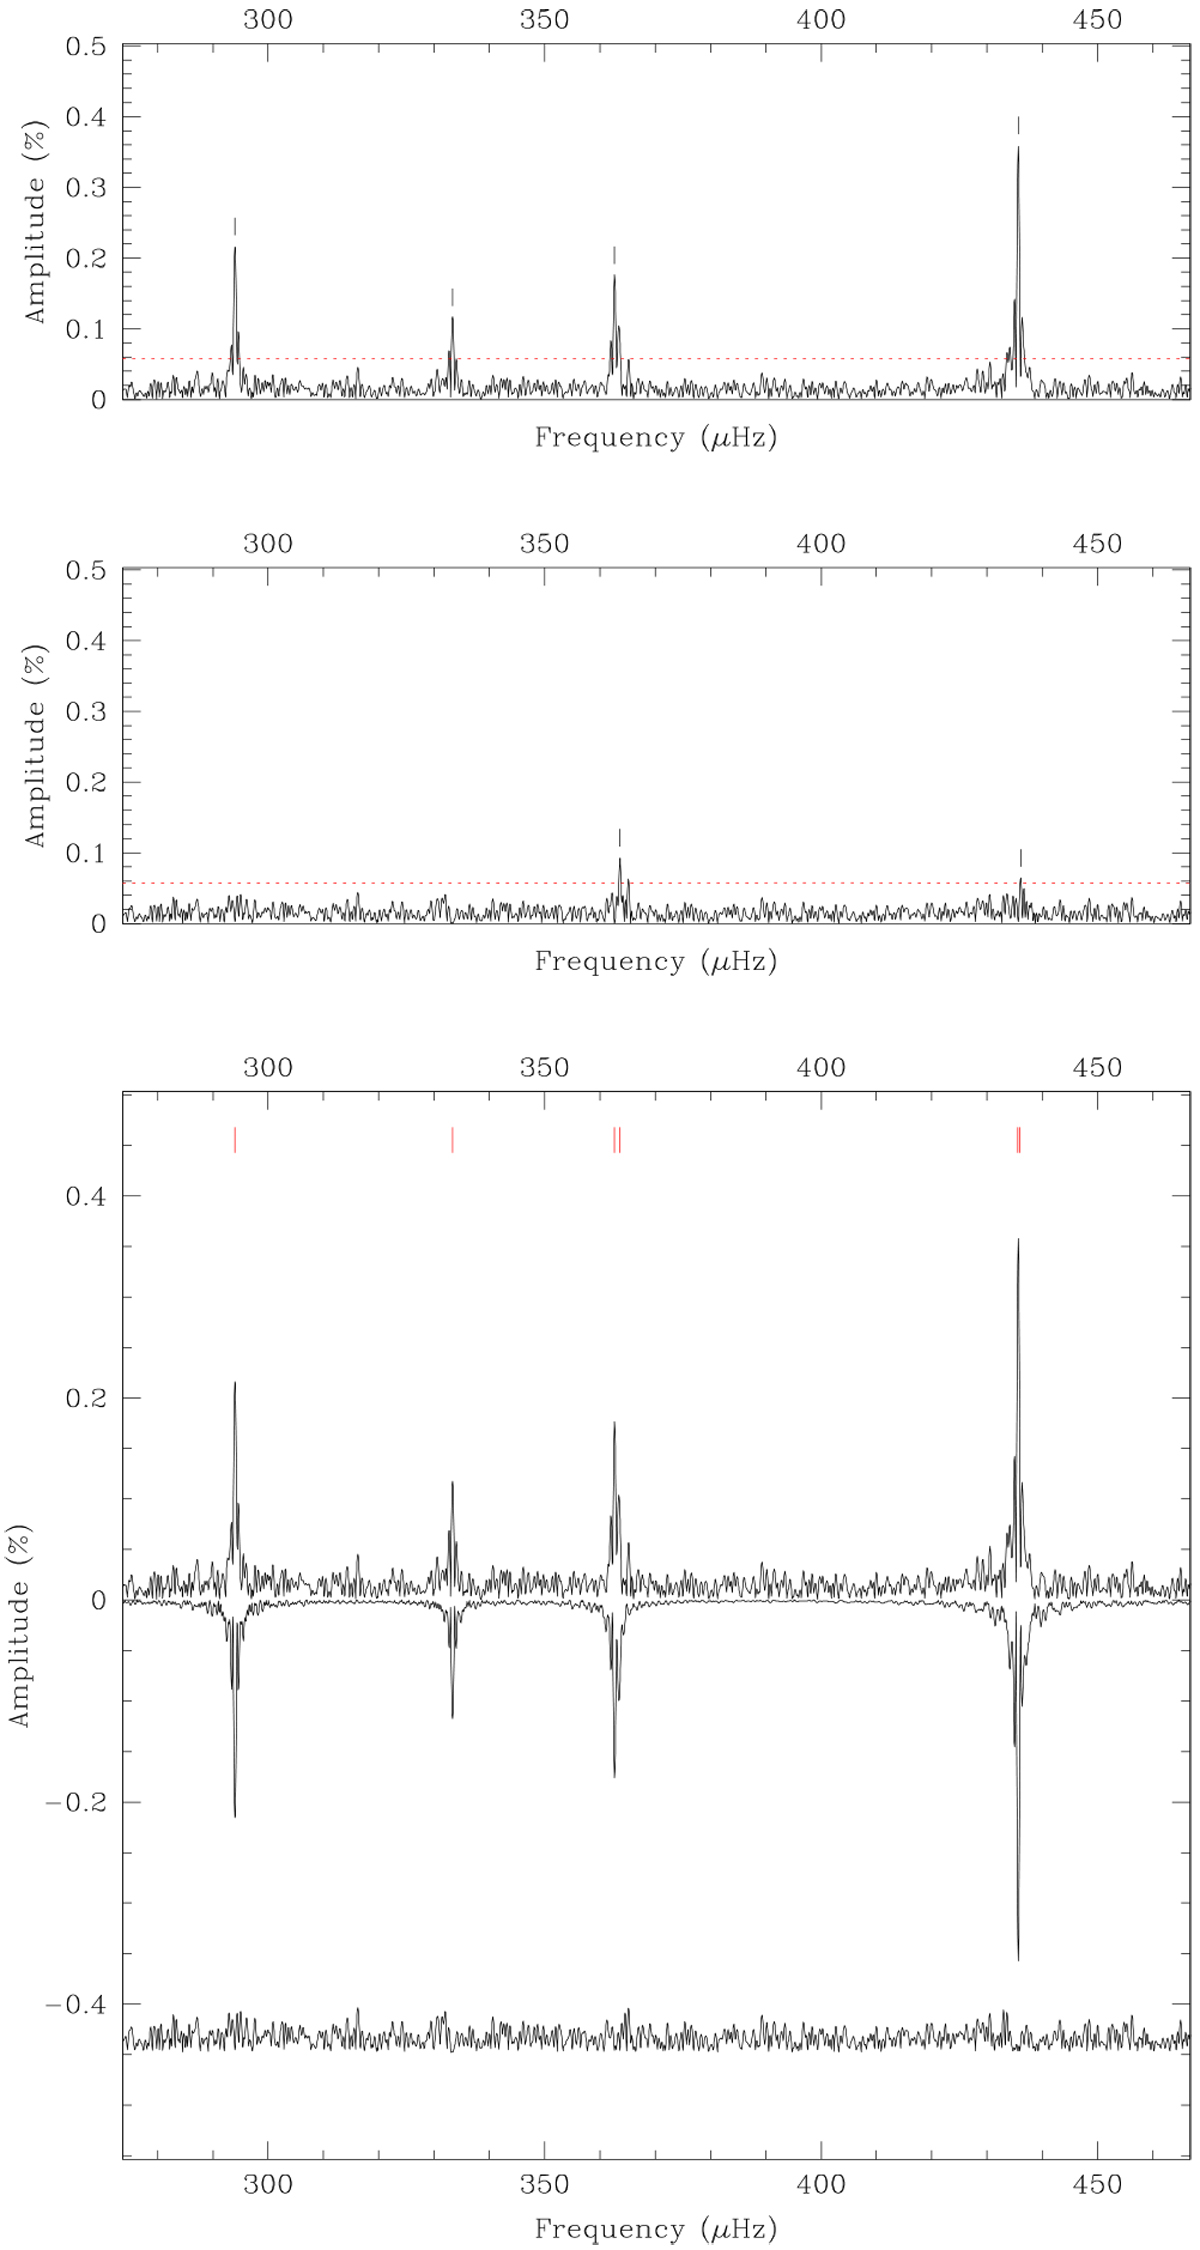
Pre-whitening sequence of detected pulsation modes. Top panel: Lomb-Scargle Periodogram of the TESS time series in the relevant 270−420 μHz frequency range. The horizontal dotted line indicates four times the median noise level and corresponds to the chosen detection limit. Middle panel: residual periodogram after pre-whitening the four dominant peaks identified in the top panel. Two additional low-amplitude peaks are identified. Bottom panel: from top to bottom are the original, reconstructed (from the frequencies, amplitudes, and phases of the six fitted sine waves; plotted upside down) and residual periodograms after completing the pre-whitening process.
Current usage metrics show cumulative count of Article Views (full-text article views including HTML views, PDF and ePub downloads, according to the available data) and Abstracts Views on Vision4Press platform.
Data correspond to usage on the plateform after 2015. The current usage metrics is available 48-96 hours after online publication and is updated daily on week days.
Initial download of the metrics may take a while.