Fig. 1
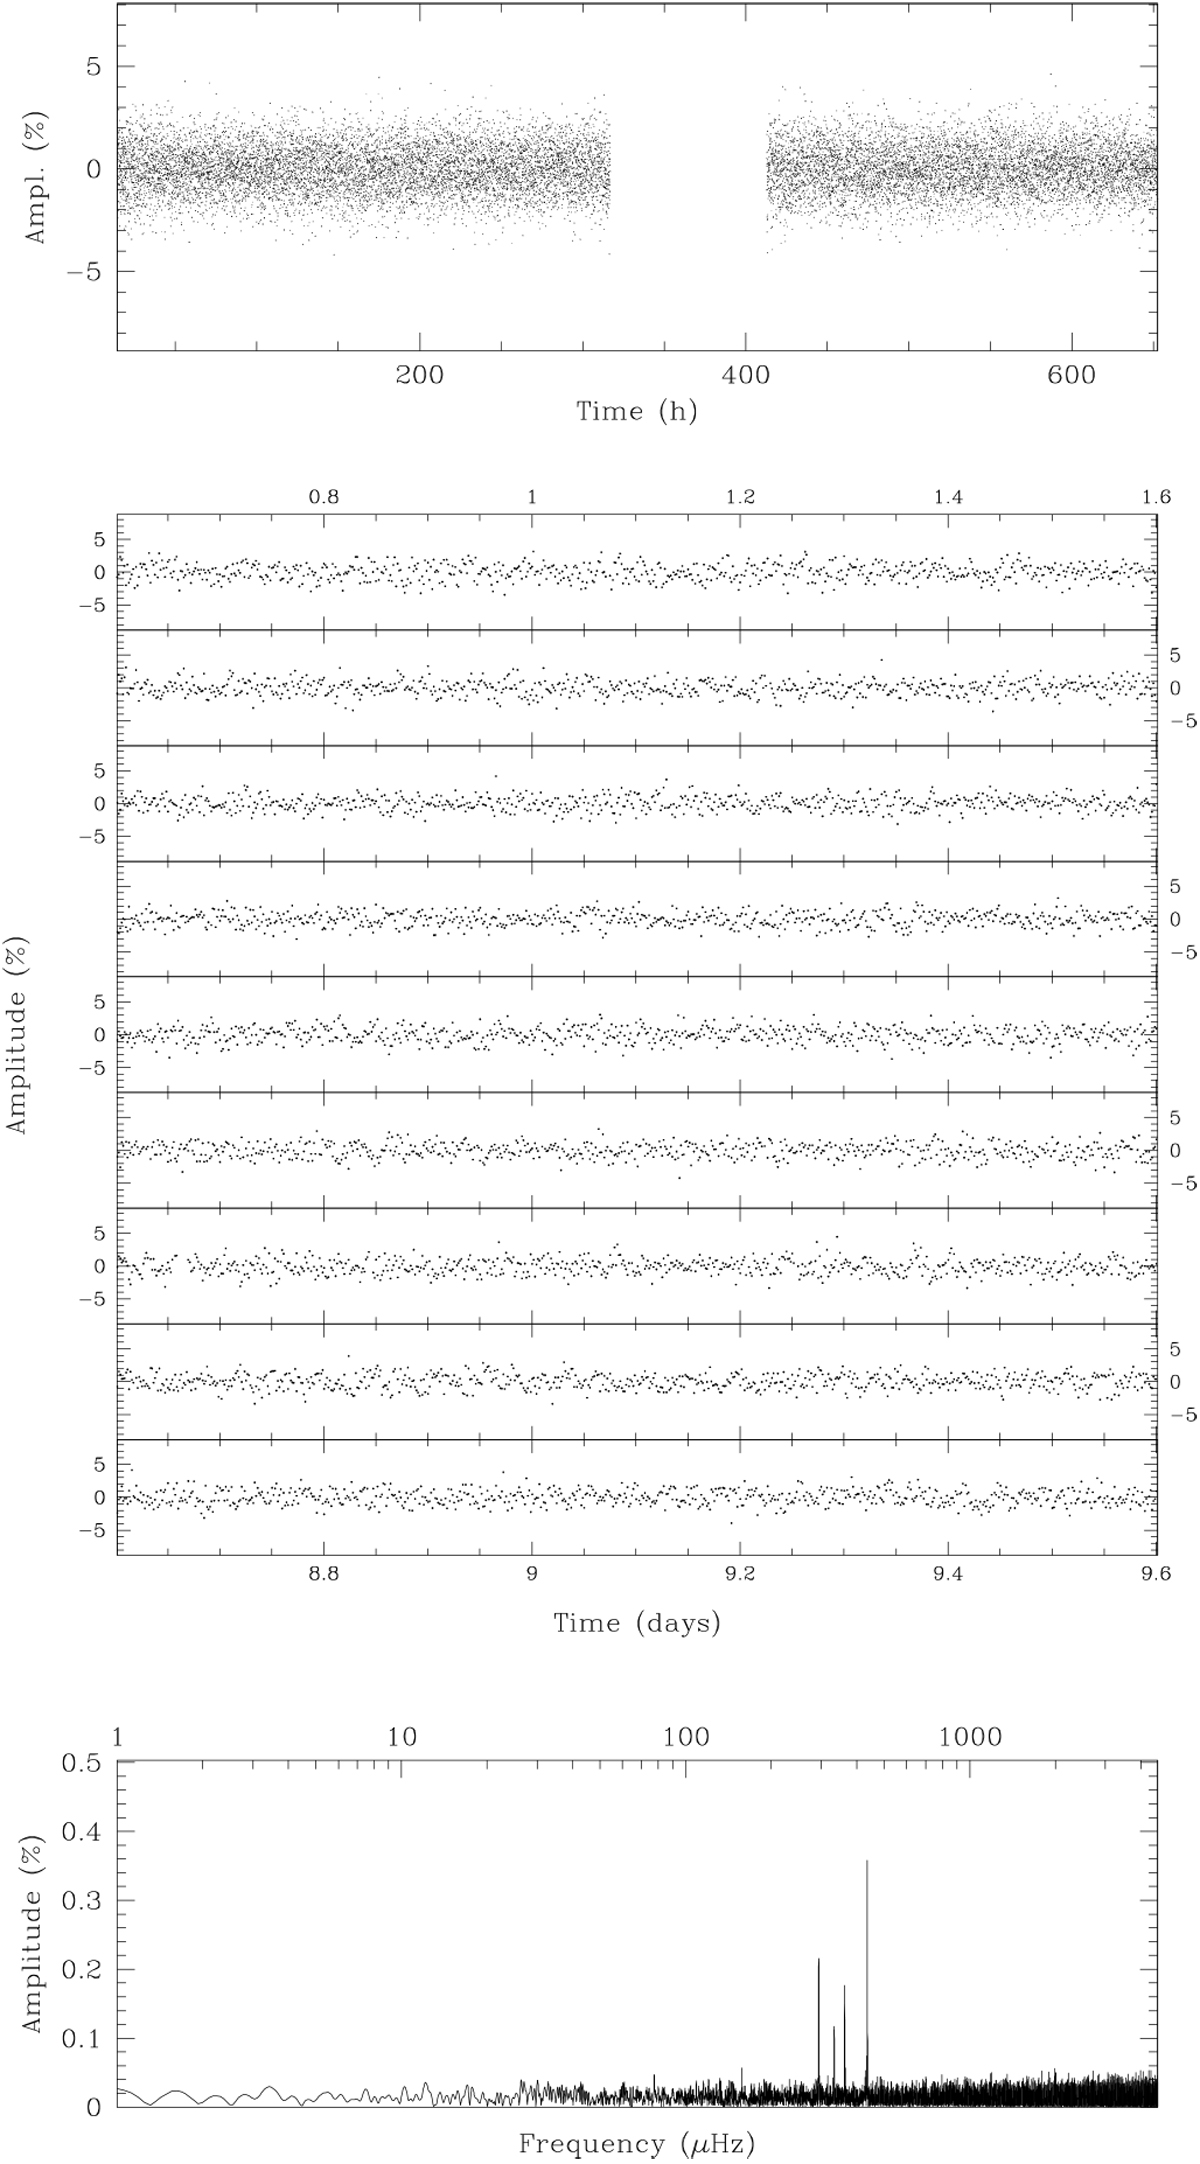
Photometry obtained for Feige 46 (TIC 371813244) with TESS. Top panel: light curve from Sector 22 (amplitude is in percentof the mean brightness of the star) spanning 26.59 d (638.16 h) sampled every 120 s. Gaps in this time series are caused by the mid-sector interruption during data download and measurements removed from the light curve because of a non-optimal quality warning. Middle panel: close-up view of the light curve covering the first nine days, where modulationsare visible. Bottom panel: Lomb-Scargle Periodogram of the light curve up to the Nyquist frequency limit (~ 4167μHz). Significant periodic signal is clearly detected in the 250−500 μHz range.
Current usage metrics show cumulative count of Article Views (full-text article views including HTML views, PDF and ePub downloads, according to the available data) and Abstracts Views on Vision4Press platform.
Data correspond to usage on the plateform after 2015. The current usage metrics is available 48-96 hours after online publication and is updated daily on week days.
Initial download of the metrics may take a while.