Fig. 9.
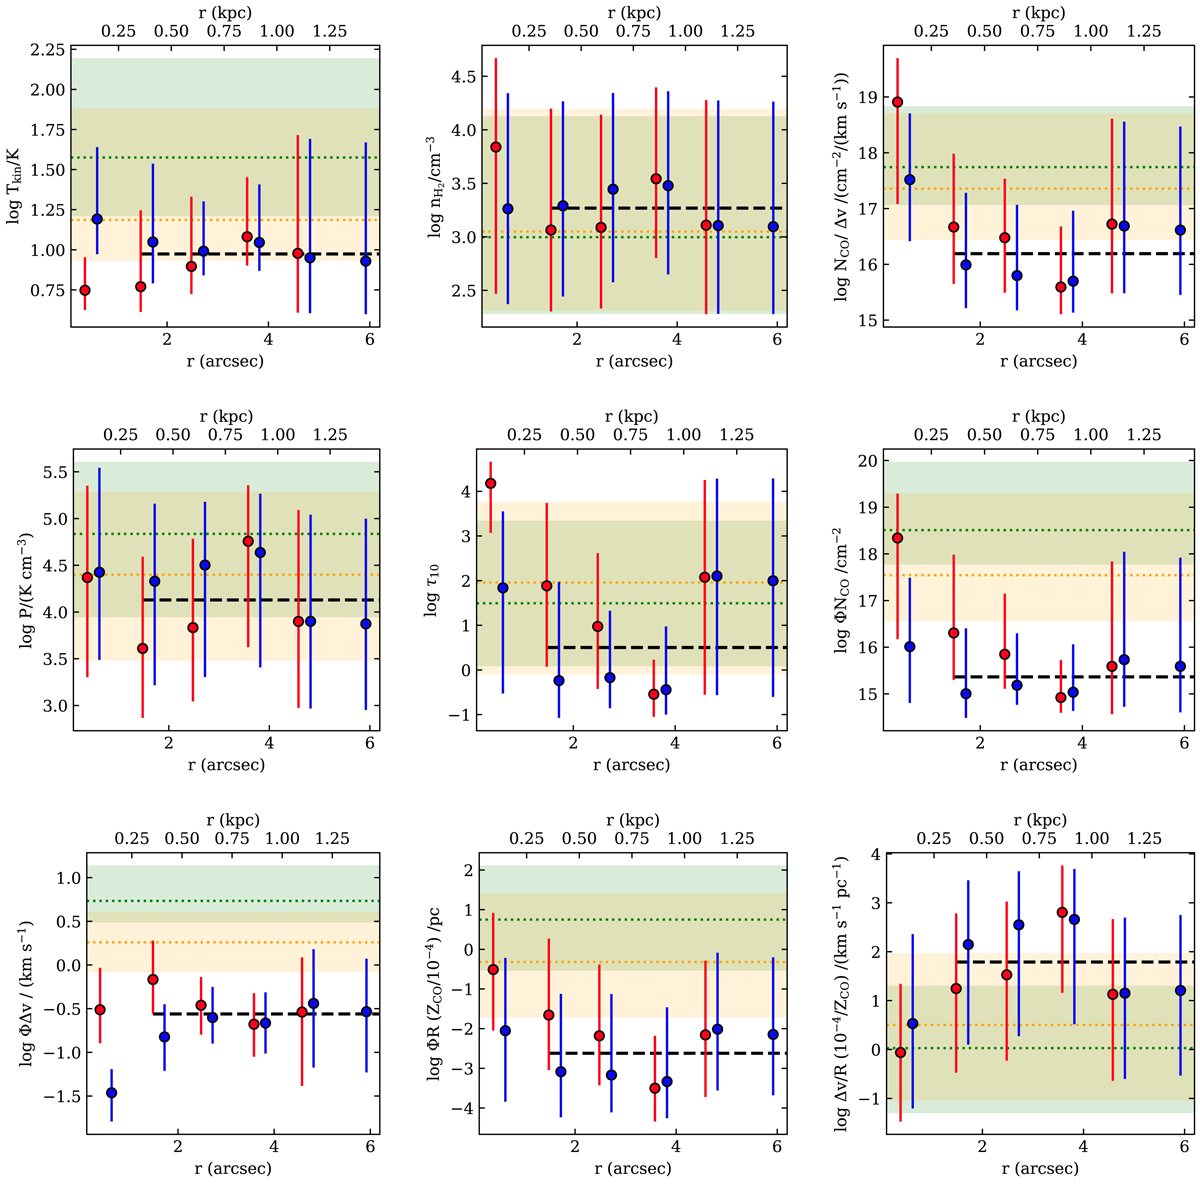
Radial dependence of the parameters (kinetic temperature Tkin, number density nH2, ratio between the CO column density and the line width NCO/Δv, pressure P, optical depth of the CO(1–0) transition τ10, angular area filling factor Φ times NCO, Δv, and the radius of the cloud R, and the Δv/R ratio) derived from the radiative transfer modeling (Sect. 3.4 and Table 4). The red and blue points correspond to the red- and blue-shifted sides of the outflow. The dashed black line is the average outflow value for rproj > 250 pc. The green (orange) shaded range and the dashed green (orange) line are the 1σ range and average value for the nucleus (disk GMC). The dashed black line corresponds to the average value in the outflow for r > 250 pc.
Current usage metrics show cumulative count of Article Views (full-text article views including HTML views, PDF and ePub downloads, according to the available data) and Abstracts Views on Vision4Press platform.
Data correspond to usage on the plateform after 2015. The current usage metrics is available 48-96 hours after online publication and is updated daily on week days.
Initial download of the metrics may take a while.