Fig. 8.
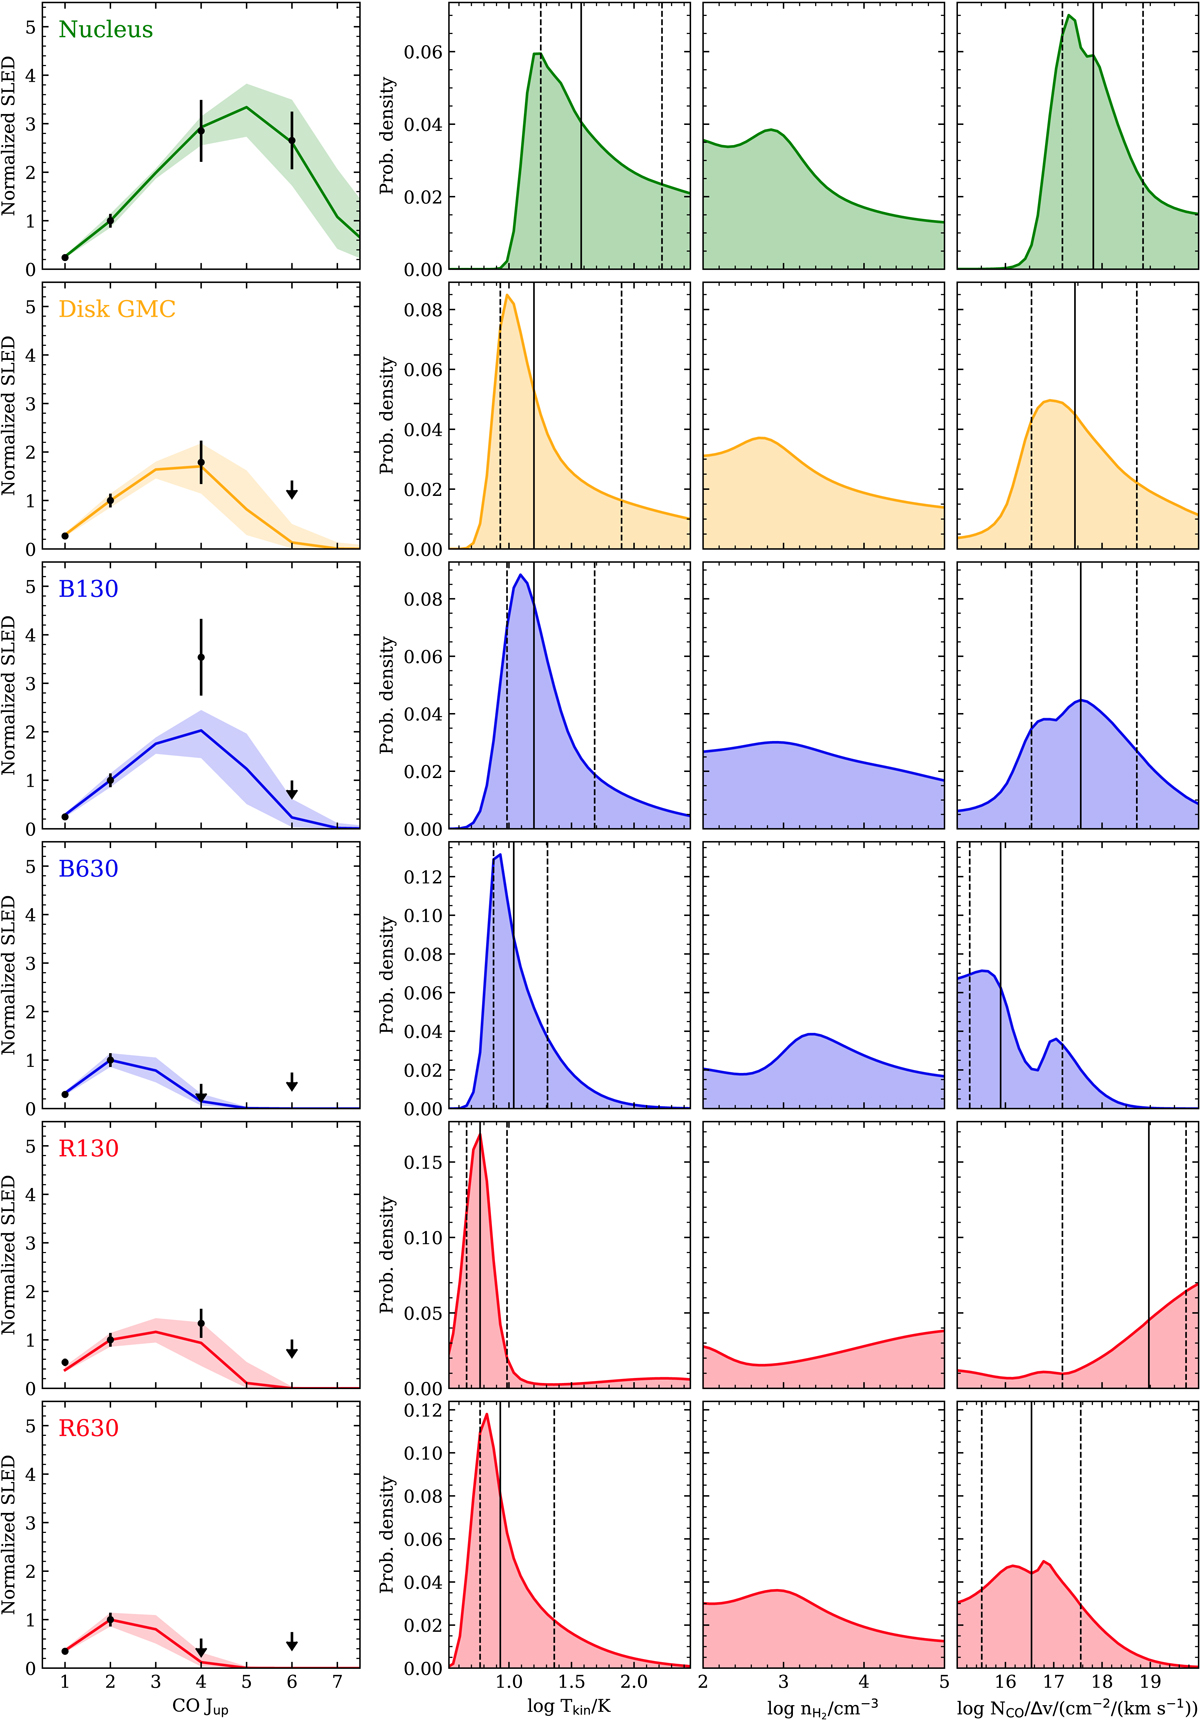
Row: best fitting CO SLEDs models and the probability density distributions of the model parameters (Tkin, nH2, and NCO/Δv) for the nucleus, the average disk GMC, and four annulus sectors of the blue- and red-shifted outflow emission (B130, B630, R130, and R630). The left panels show the normalized CO SLED (black points and upper limits) and the best fitting SLED (color solid line) and its 1σ dispersion (color shaded area). The other panels show the probability density distributions. The vertical solid line marks the median value and the dashed lines the ±1σ range. We do not show the median and ±1σ range in the nH2 panel because it is not well constrained by these observations. These distributions are obtained assuming a uniform prior for the three parameters.
Current usage metrics show cumulative count of Article Views (full-text article views including HTML views, PDF and ePub downloads, according to the available data) and Abstracts Views on Vision4Press platform.
Data correspond to usage on the plateform after 2015. The current usage metrics is available 48-96 hours after online publication and is updated daily on week days.
Initial download of the metrics may take a while.