Fig. 7.
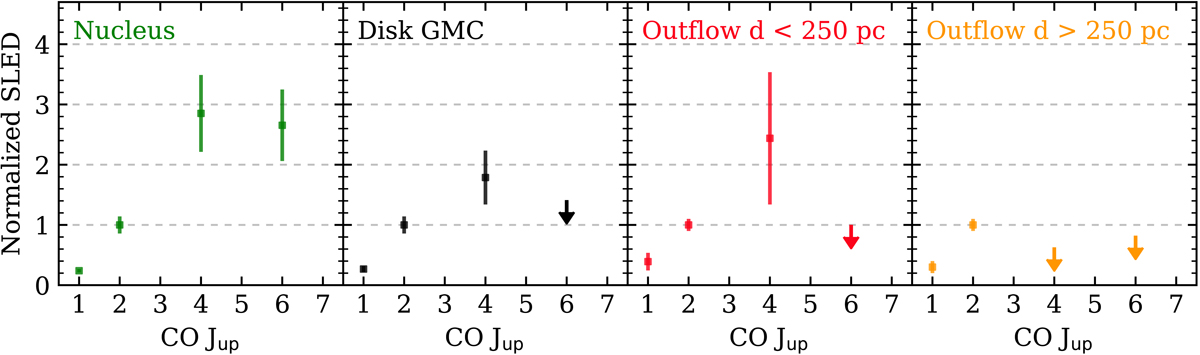
CO SLEDs normalized to the flux of the CO(2–1) transition. The nuclear SLED corresponds to the central 100 pc (diameter = 0![]() 4). The Disk GMC panel shows the average CO SLED of the gas in the disk and the two outflow panels show the average SLEDs for the inner annulus sector (distance < 250 pc) and the rest of sectors, respectively (see Figs. 5 and 6). The uncertainties include both flux uncertainties and the spatial variations of the SLED within each region.
4). The Disk GMC panel shows the average CO SLED of the gas in the disk and the two outflow panels show the average SLEDs for the inner annulus sector (distance < 250 pc) and the rest of sectors, respectively (see Figs. 5 and 6). The uncertainties include both flux uncertainties and the spatial variations of the SLED within each region.
Current usage metrics show cumulative count of Article Views (full-text article views including HTML views, PDF and ePub downloads, according to the available data) and Abstracts Views on Vision4Press platform.
Data correspond to usage on the plateform after 2015. The current usage metrics is available 48-96 hours after online publication and is updated daily on week days.
Initial download of the metrics may take a while.