Fig. 5.
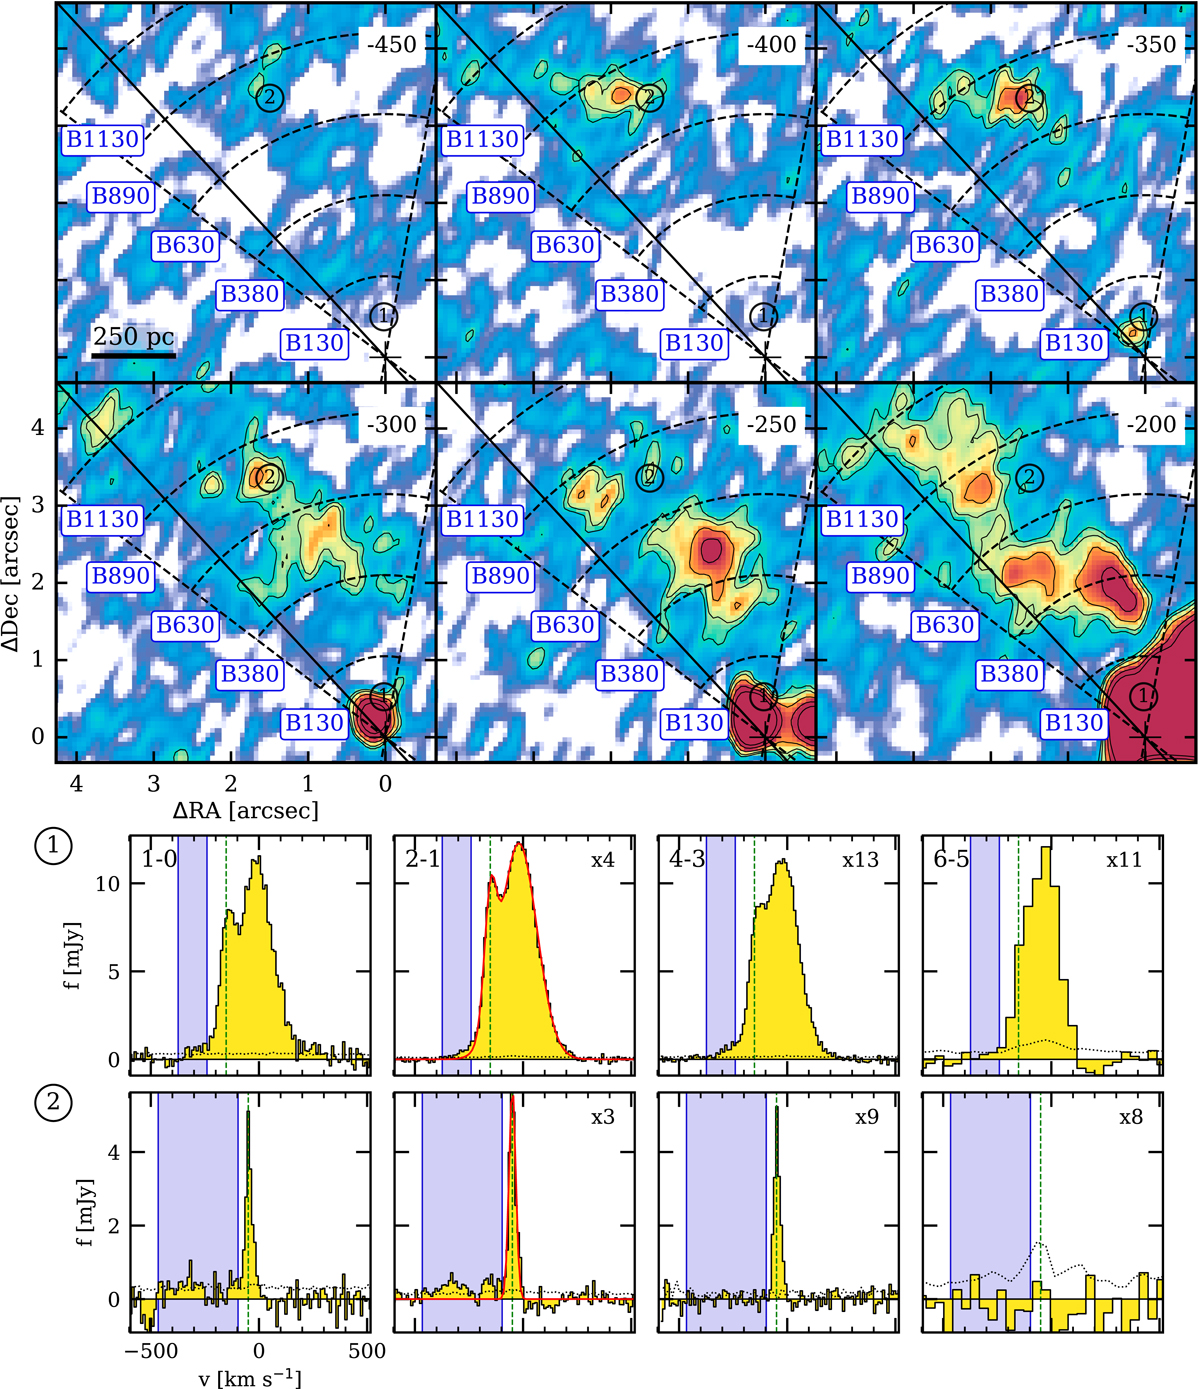
Top panels: high-velocity blue-shifted CO(2–1) channel maps (vlos from −450 to −200 km s−1 as indicated at the top right corner of each map). The black solid line is the kinematic minor axis of the galaxy and the radial dashed lines mark the angular extent of the outflow emission (see Fig. 3). The dashed arcs delimit the annular sectors used to measure the resolved outflow CO SLEDs. The B130 to B1130 labels indicate the projected separation in parsec between the nucleus and the centers of the annulus sectors. Bottom panels: CO(1–0), CO(2–1), CO(4–3), and CO(6–5) integrated spectra of two regions as an example (see Sect. 3.2). The location of these two regions is marked in the top maps with a circled number in the B130 and B890 sectors. The spectra are scaled by the factors at the upper right corner of each panel. The dashed green vertical lines mark the disk rotation velocity derived from the kinematic model at each position (Sect. 3.2). The red line in the CO(2–1) panel is the best fitting one- or two-Gaussian model. The blue shaded area indicates the spectral channels that are used to measure the high-velocity CO molecular emission. The dotted black line is the 1σ noise level measured in each channel.
Current usage metrics show cumulative count of Article Views (full-text article views including HTML views, PDF and ePub downloads, according to the available data) and Abstracts Views on Vision4Press platform.
Data correspond to usage on the plateform after 2015. The current usage metrics is available 48-96 hours after online publication and is updated daily on week days.
Initial download of the metrics may take a while.