Fig. 3.
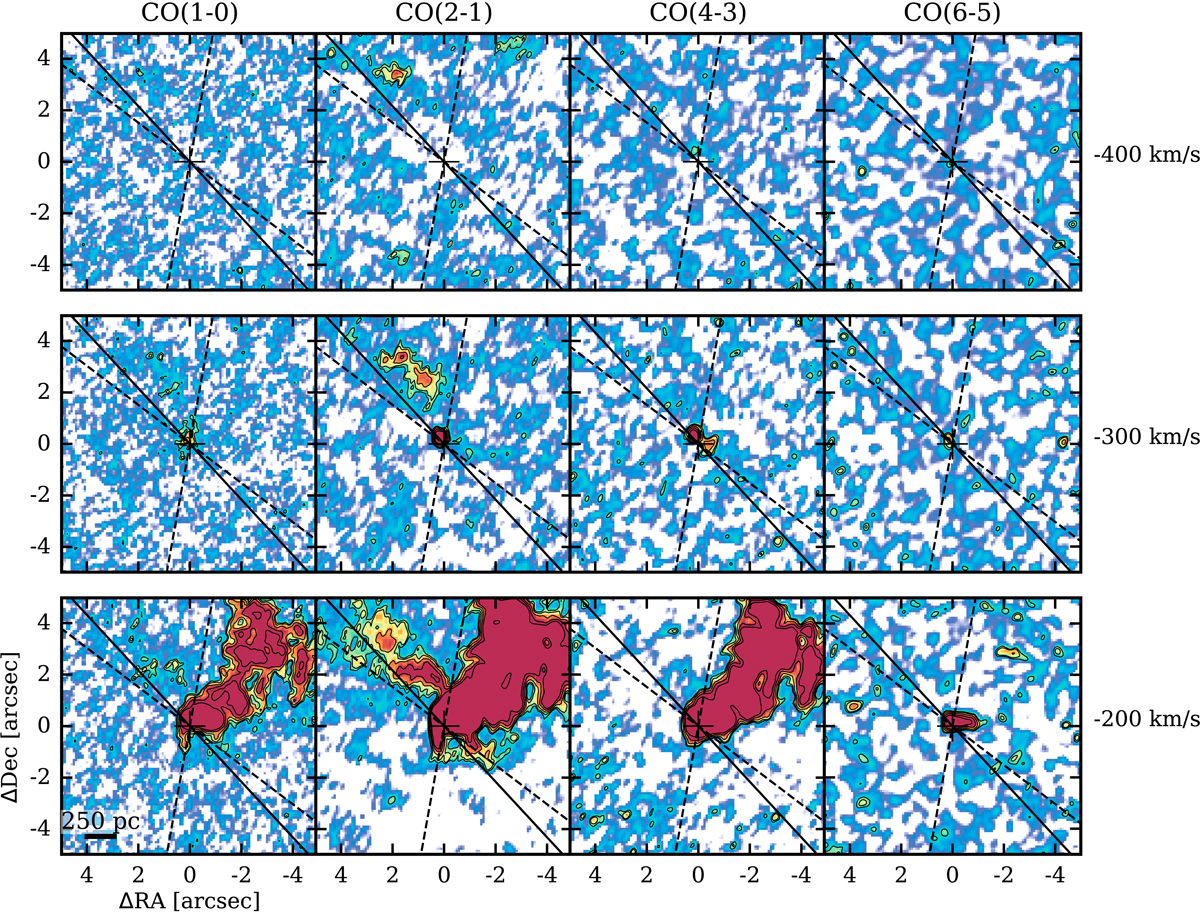
Channel maps of the CO 1–0, 2–1, 4–3, and 6–5 transitions (from left to right) centered at observed velocities blue-shifted with respect to systemic by −400, −300, and −200 km s−1 (from top to bottom). The channel width is 100 km s−1. The contour levels are 3, 4, 6, 9, 13 times the σ of each channel map (0.2, 0.2, 0.9, 4.4 mJy beam−1). The color scale is saturated at 9σ to highlight emission at high velocities associated with the outflow. The solid black line is kinematic minor axis (PA =43°) derived from the kinematic model (Pereira-Santaella et al. 2016). The dashed lines delimit the area where the high-velocity molecular outflow is detected (PAs from −10° to 53°). The black cross marks the position of the nucleus derived from the ALMA continuum emission (see Pereira-Santaella et al. 2017). The physical scale at the distance of this galaxy is indicated in the lower left panel.
Current usage metrics show cumulative count of Article Views (full-text article views including HTML views, PDF and ePub downloads, according to the available data) and Abstracts Views on Vision4Press platform.
Data correspond to usage on the plateform after 2015. The current usage metrics is available 48-96 hours after online publication and is updated daily on week days.
Initial download of the metrics may take a while.