Fig. 2.
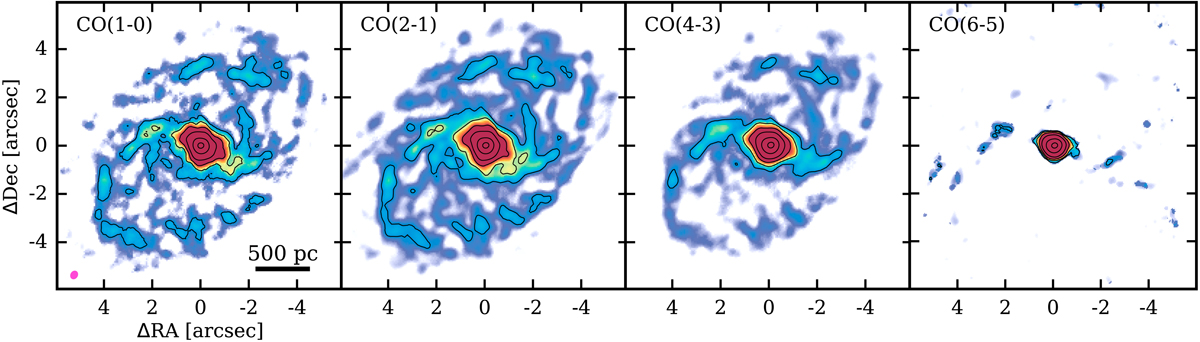
CO 1–0, 2–1, 4–3, and 6–5 line emission maps (zero moment maps) of ESO 320-G030. The emission is dominated by the nuclear regions, so we saturated the color scale at 10% of the emission peak to reveal the secondary bar and the internal spiral arms. The black contour levels are 0.02, 0.05, 0.1, 0.2, 0.5, 0.9 times the emission peak in each map (13.8, 61, 182, 242 Jy km s−1 beam−1 for the 1–0, 2–1, 4–3, and 6–5 panels, respectively). The pink ellipse in the first panel represents the beam size (0![]() 37 × 0
37 × 0![]() 30; PA −32°), which is common for the 4 panels (see Sect. 2.2). The physical scale at the distance of this galaxy is indicated in the first panel. The gray lines in the CO(4–3) and CO(6–5) panels indicate the shape of the primary beam. For the CO(1–0) and CO(2–1) panels, the primary beam is larger than the field of view presented in this figure.
30; PA −32°), which is common for the 4 panels (see Sect. 2.2). The physical scale at the distance of this galaxy is indicated in the first panel. The gray lines in the CO(4–3) and CO(6–5) panels indicate the shape of the primary beam. For the CO(1–0) and CO(2–1) panels, the primary beam is larger than the field of view presented in this figure.
Current usage metrics show cumulative count of Article Views (full-text article views including HTML views, PDF and ePub downloads, according to the available data) and Abstracts Views on Vision4Press platform.
Data correspond to usage on the plateform after 2015. The current usage metrics is available 48-96 hours after online publication and is updated daily on week days.
Initial download of the metrics may take a while.