Fig. 11.
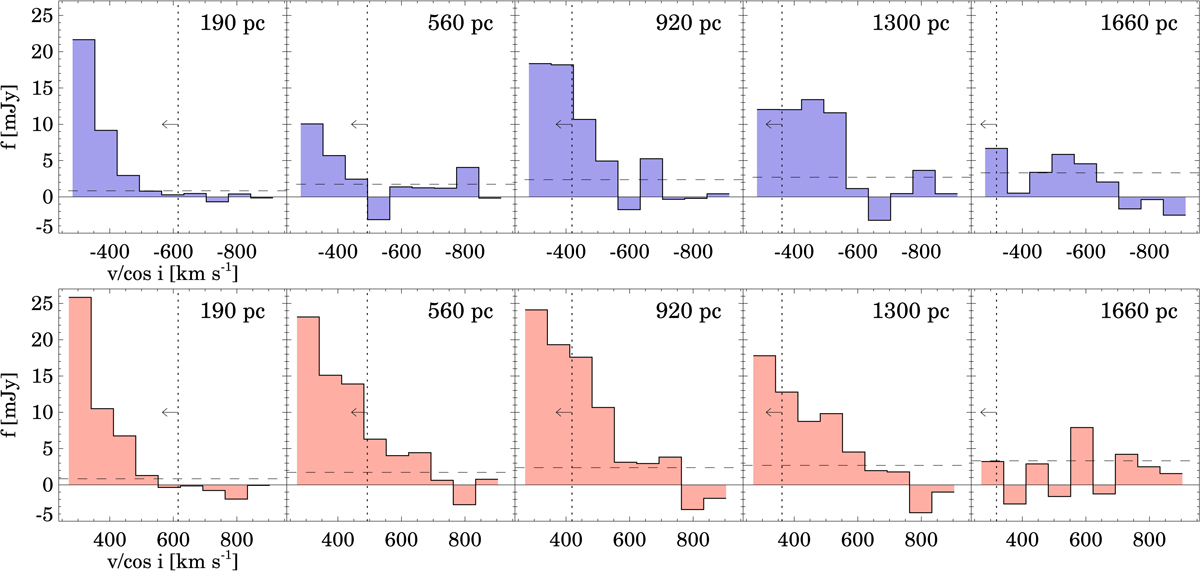
High-velocity, |vproj| > 200 km s−1, CO(2–1) outflow emission measured in the annulus sectors presented in Figs. 5 and 6. The top and bottom panels correspond to the blue- and red-shifted emissions of the outflow, respectively. The x-axis velocities and the distance to the nucleus indicated in each panel are deprojected values assuming a perpendicular to the disk outflow and a galaxy inclination, i, of 43° (Pereira-Santaella et al. 2016). The dotted vertical line traces the expected velocity of a cloud in the gravitational potential at each distance with an initial v ∼ 600 km s−1 at 190 pc. The horizontal dashed line indicates the average 1σ noise of the spectra per channel.
Current usage metrics show cumulative count of Article Views (full-text article views including HTML views, PDF and ePub downloads, according to the available data) and Abstracts Views on Vision4Press platform.
Data correspond to usage on the plateform after 2015. The current usage metrics is available 48-96 hours after online publication and is updated daily on week days.
Initial download of the metrics may take a while.