Free Access
Fig. 10.
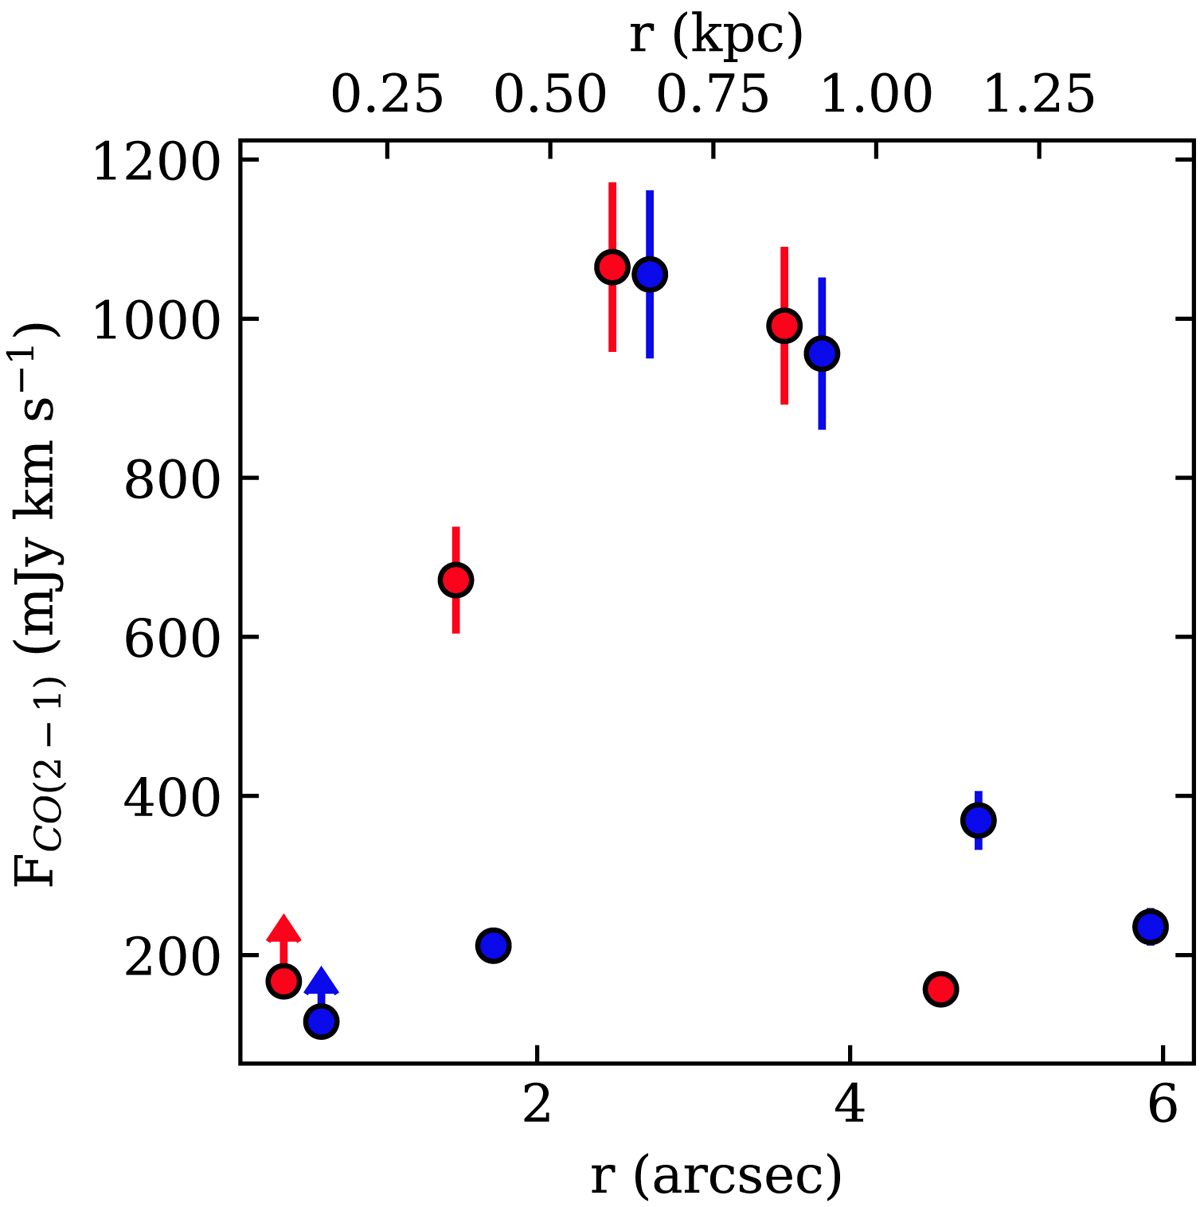
CO(2–1) flux of the outflow as a function of the projected distance to the nucleus measured in the annulus sector. The red and blue points correspond to the red- and blue-shifted sides of the outflow. The fluxes of the inner annulus sector (rproj ∼ 130 pc) should be considered as lower limits (see Sect. 3.2).
Current usage metrics show cumulative count of Article Views (full-text article views including HTML views, PDF and ePub downloads, according to the available data) and Abstracts Views on Vision4Press platform.
Data correspond to usage on the plateform after 2015. The current usage metrics is available 48-96 hours after online publication and is updated daily on week days.
Initial download of the metrics may take a while.