Fig. 1.
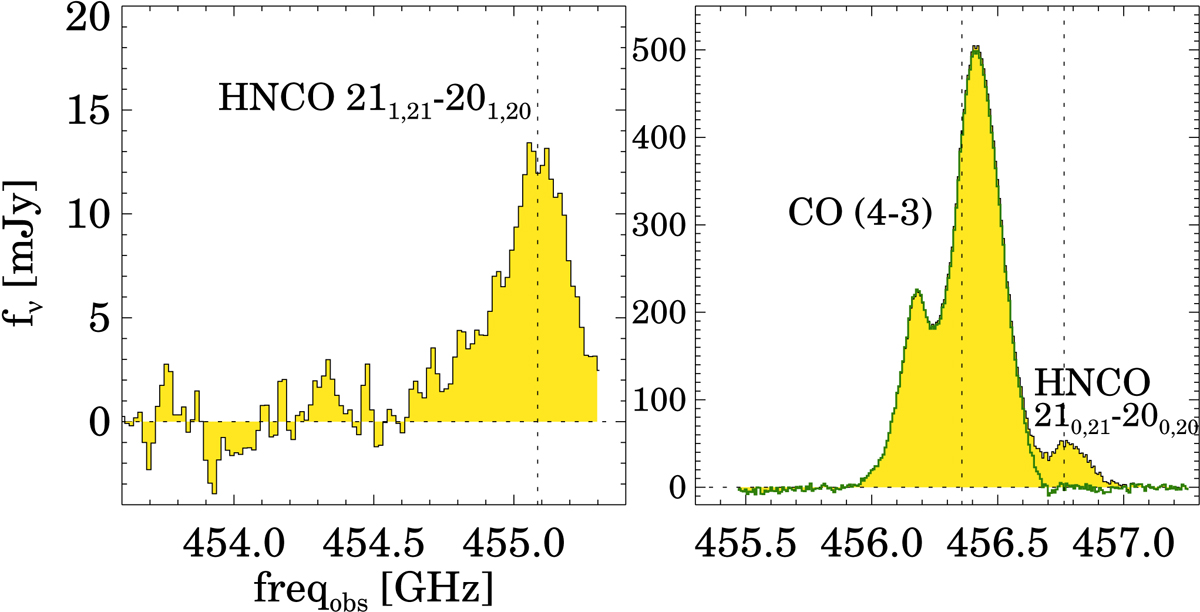
ALMA Band 8 nuclear spectrum of ESO 320-G030 (r= 0![]() 3). Each panel shows one of the spectral windows where two HNCO transitions and CO(4–3) are detected (see Sect. 2.1). We note that part of the blue wing of the HNCO 211, 21 − 201, 20 transition (left panel) is not covered by the observed spectral window. The vertical dashed lines mark the expected frequency of the HNCO and CO transitions based on the systemic velocity. The green histogram in the right panel shows the nuclear CO(4–3) spectrum after subtracting the HNCO emission.
3). Each panel shows one of the spectral windows where two HNCO transitions and CO(4–3) are detected (see Sect. 2.1). We note that part of the blue wing of the HNCO 211, 21 − 201, 20 transition (left panel) is not covered by the observed spectral window. The vertical dashed lines mark the expected frequency of the HNCO and CO transitions based on the systemic velocity. The green histogram in the right panel shows the nuclear CO(4–3) spectrum after subtracting the HNCO emission.
Current usage metrics show cumulative count of Article Views (full-text article views including HTML views, PDF and ePub downloads, according to the available data) and Abstracts Views on Vision4Press platform.
Data correspond to usage on the plateform after 2015. The current usage metrics is available 48-96 hours after online publication and is updated daily on week days.
Initial download of the metrics may take a while.