Open Access
Fig. 6.
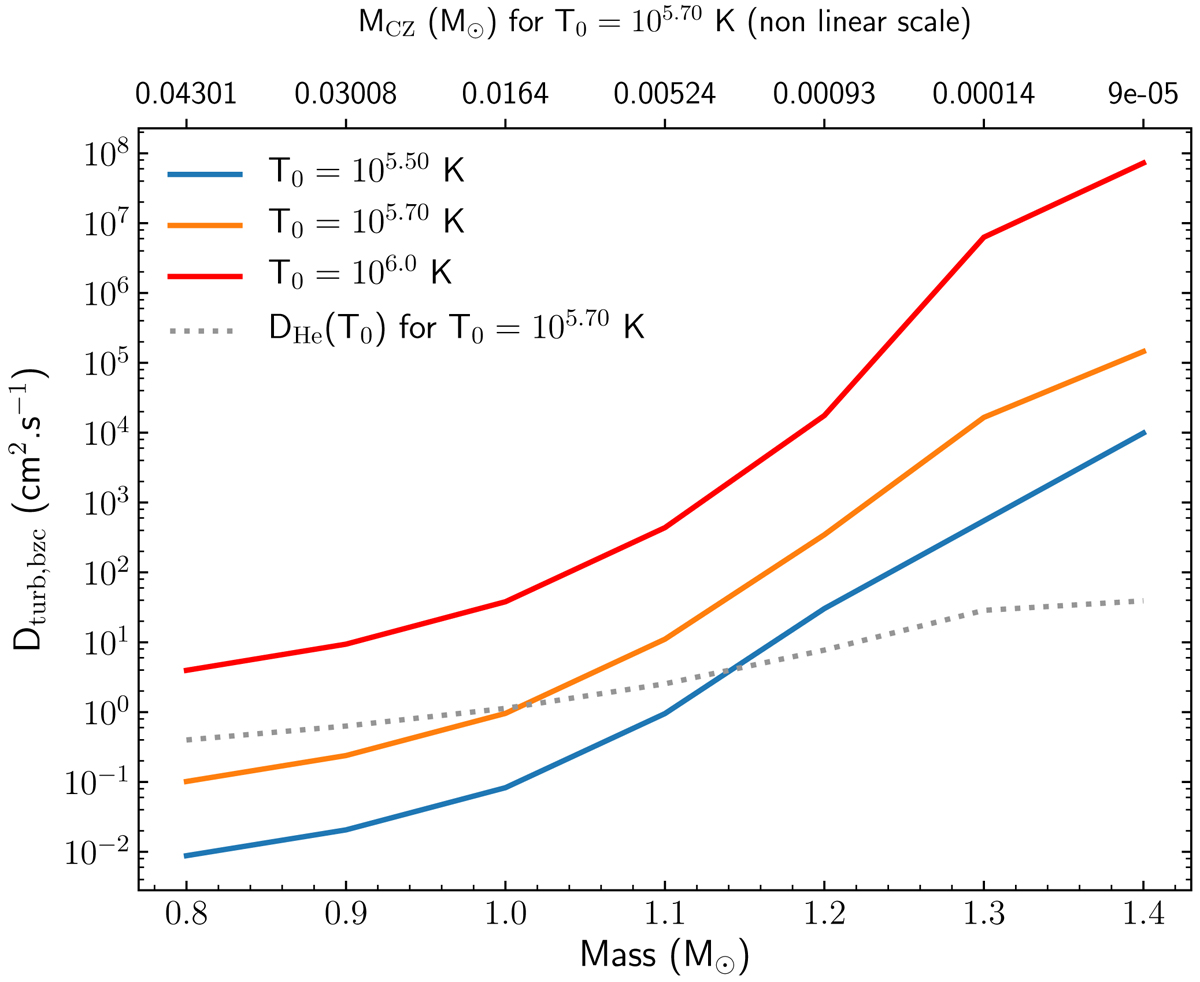
Dturb for different values of T0 at the bottom of the surface convective zone according to the mass of the models. The masses of surface convective zones are shown in the upper x-axis.
Current usage metrics show cumulative count of Article Views (full-text article views including HTML views, PDF and ePub downloads, according to the available data) and Abstracts Views on Vision4Press platform.
Data correspond to usage on the plateform after 2015. The current usage metrics is available 48-96 hours after online publication and is updated daily on week days.
Initial download of the metrics may take a while.