Fig. 2
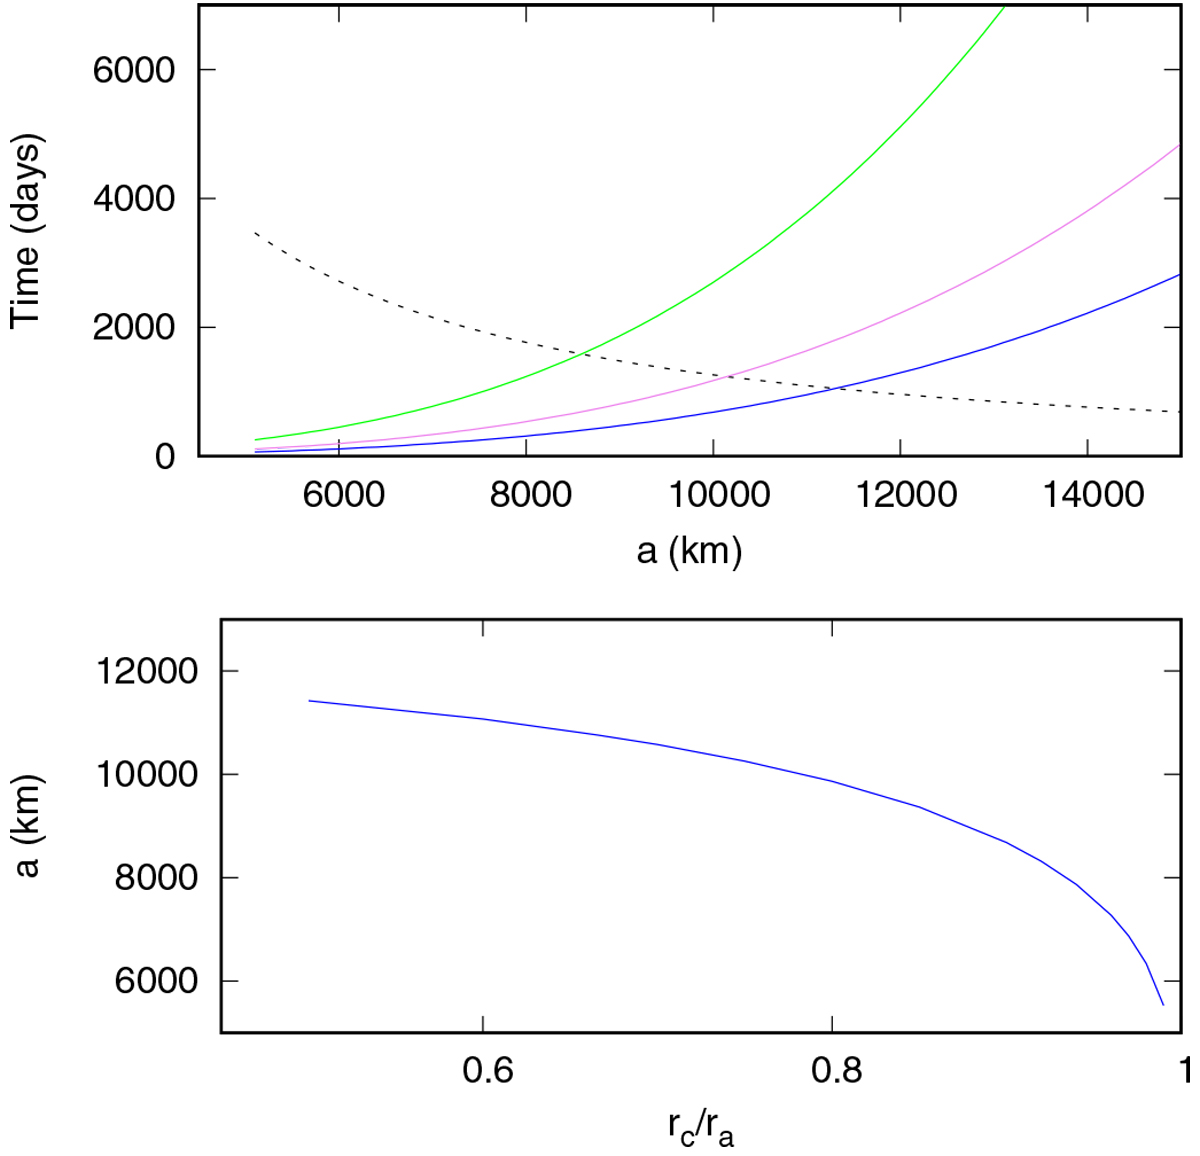
Top panel: tKL shown as a function of the semi-major axis (dashed black line) and tJ2|i = 0 plotted for different values of the ratio between the principal axes of the ellipsoid rc ∕ra. The blue line is for rc∕ra = 1∕2, the magenta line is for rc∕ra = 3∕4, and the green line is for rc∕ra = 9∕10. Bottom panel: critical semi-major axis drawn as a function of the rc∕ra ratio.
Current usage metrics show cumulative count of Article Views (full-text article views including HTML views, PDF and ePub downloads, according to the available data) and Abstracts Views on Vision4Press platform.
Data correspond to usage on the plateform after 2015. The current usage metrics is available 48-96 hours after online publication and is updated daily on week days.
Initial download of the metrics may take a while.