Free Access
Fig. 1
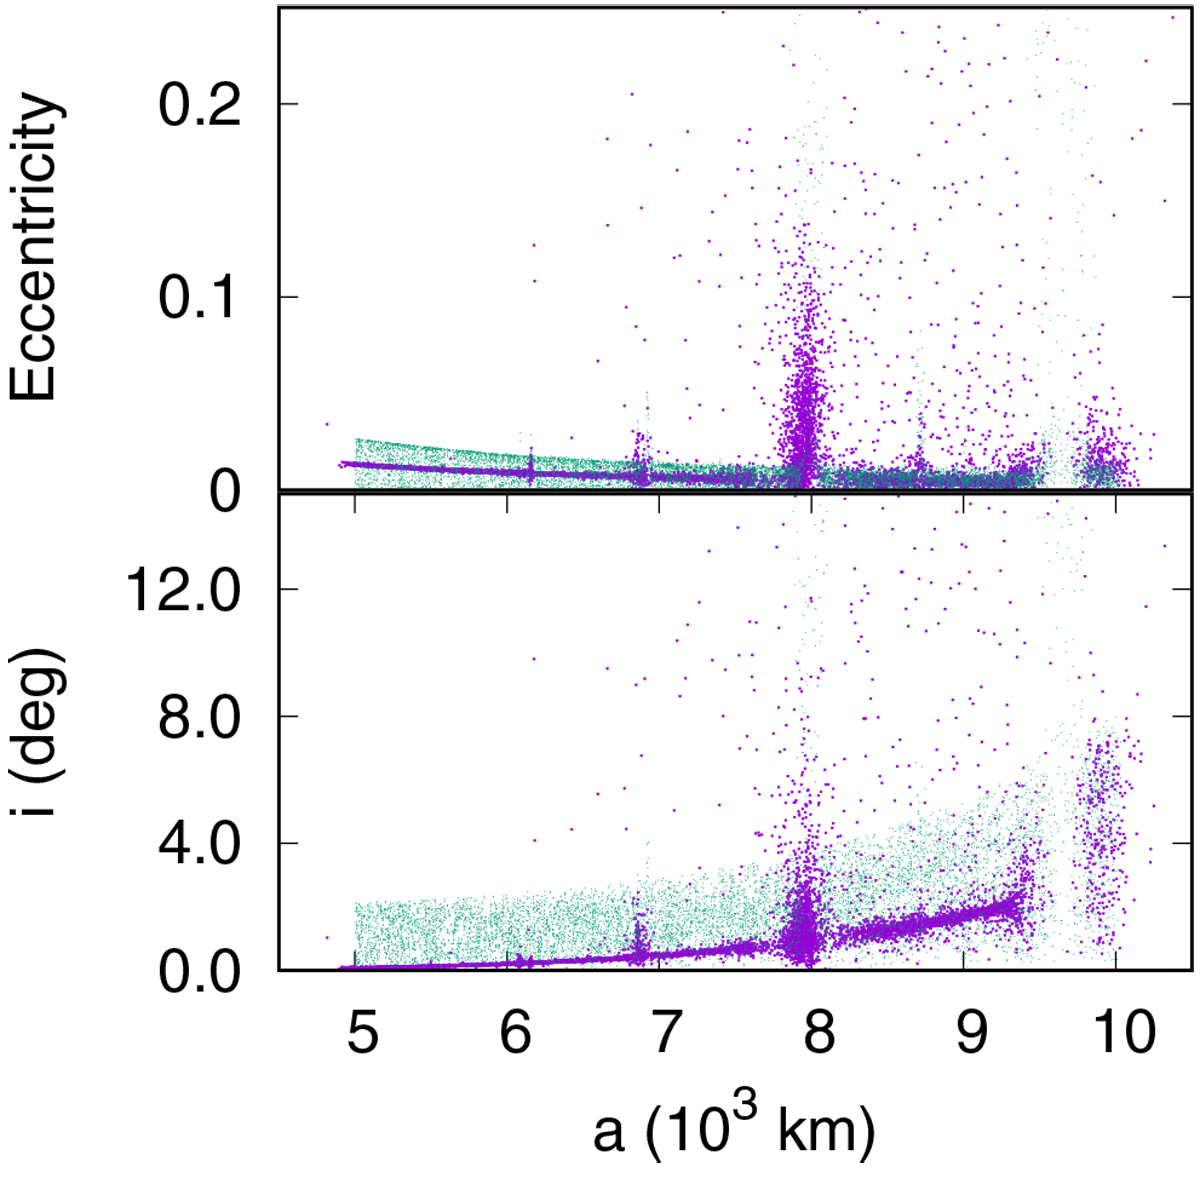
Orbital distribution of the ring particles after 250 000 days from the beginning of the simulation in the case without collisions (green circles) and with collisions (magenta circles). The observed spikes in both e and i are due to mean motion resonances with the satellite.
Current usage metrics show cumulative count of Article Views (full-text article views including HTML views, PDF and ePub downloads, according to the available data) and Abstracts Views on Vision4Press platform.
Data correspond to usage on the plateform after 2015. The current usage metrics is available 48-96 hours after online publication and is updated daily on week days.
Initial download of the metrics may take a while.