Fig. 9
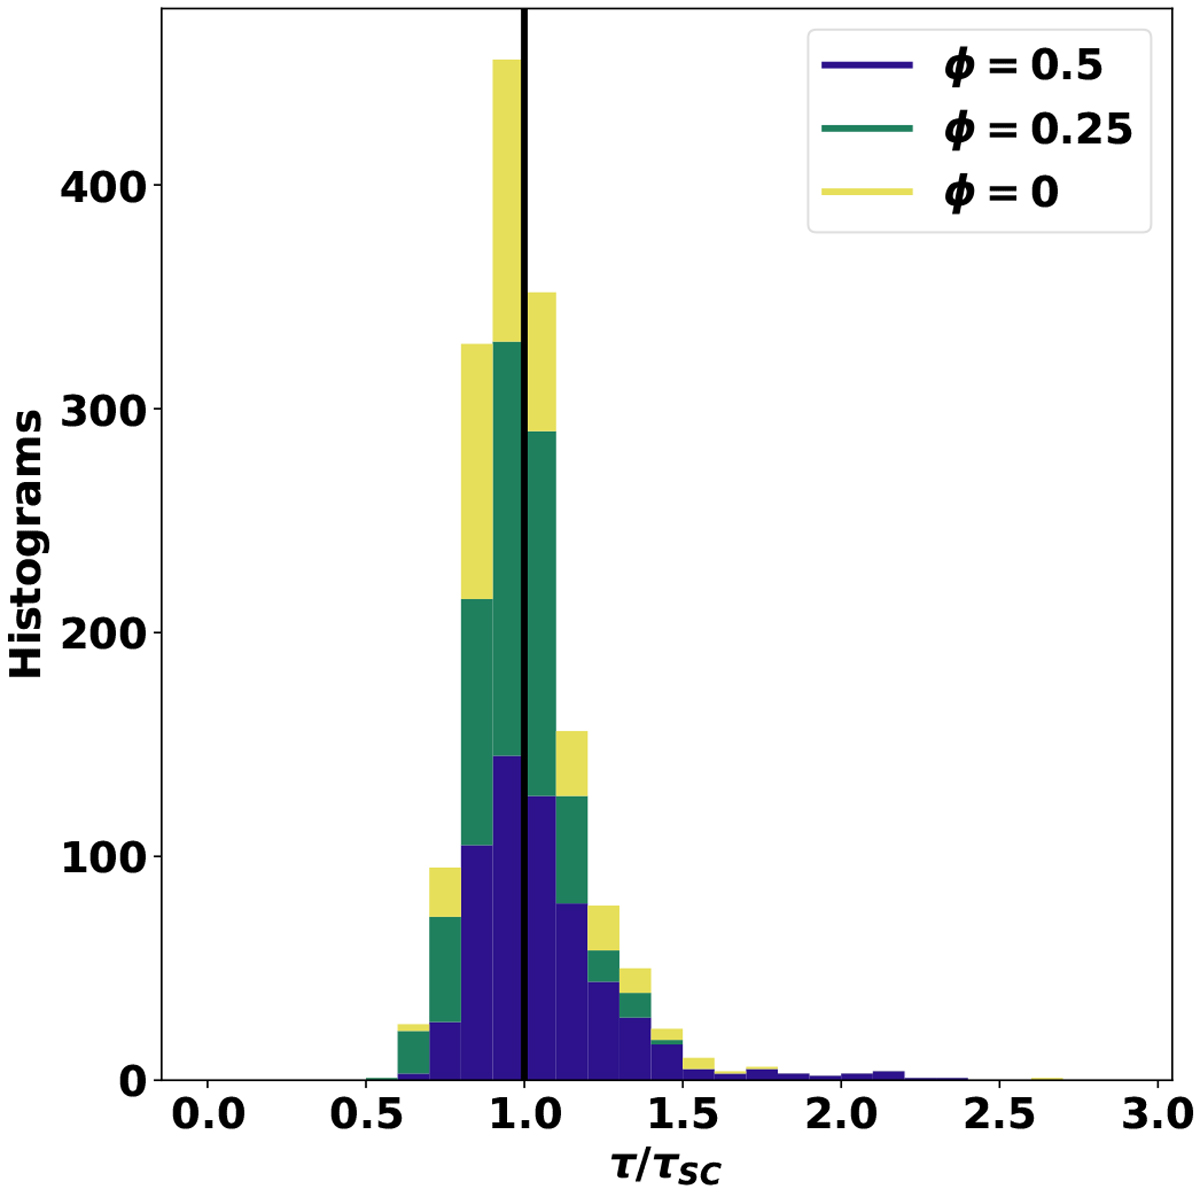
Stacked histograms of the ratios of the measured coherence time scale τ compared to the clump self-crossing time τSC for all 600 simulations at inferior conjunction (ϕ = 0.5, purple), ϕ = 0.25 (green) and superior conjunction (ϕ = 0, yellow).
Current usage metrics show cumulative count of Article Views (full-text article views including HTML views, PDF and ePub downloads, according to the available data) and Abstracts Views on Vision4Press platform.
Data correspond to usage on the plateform after 2015. The current usage metrics is available 48-96 hours after online publication and is updated daily on week days.
Initial download of the metrics may take a while.