Fig. 6
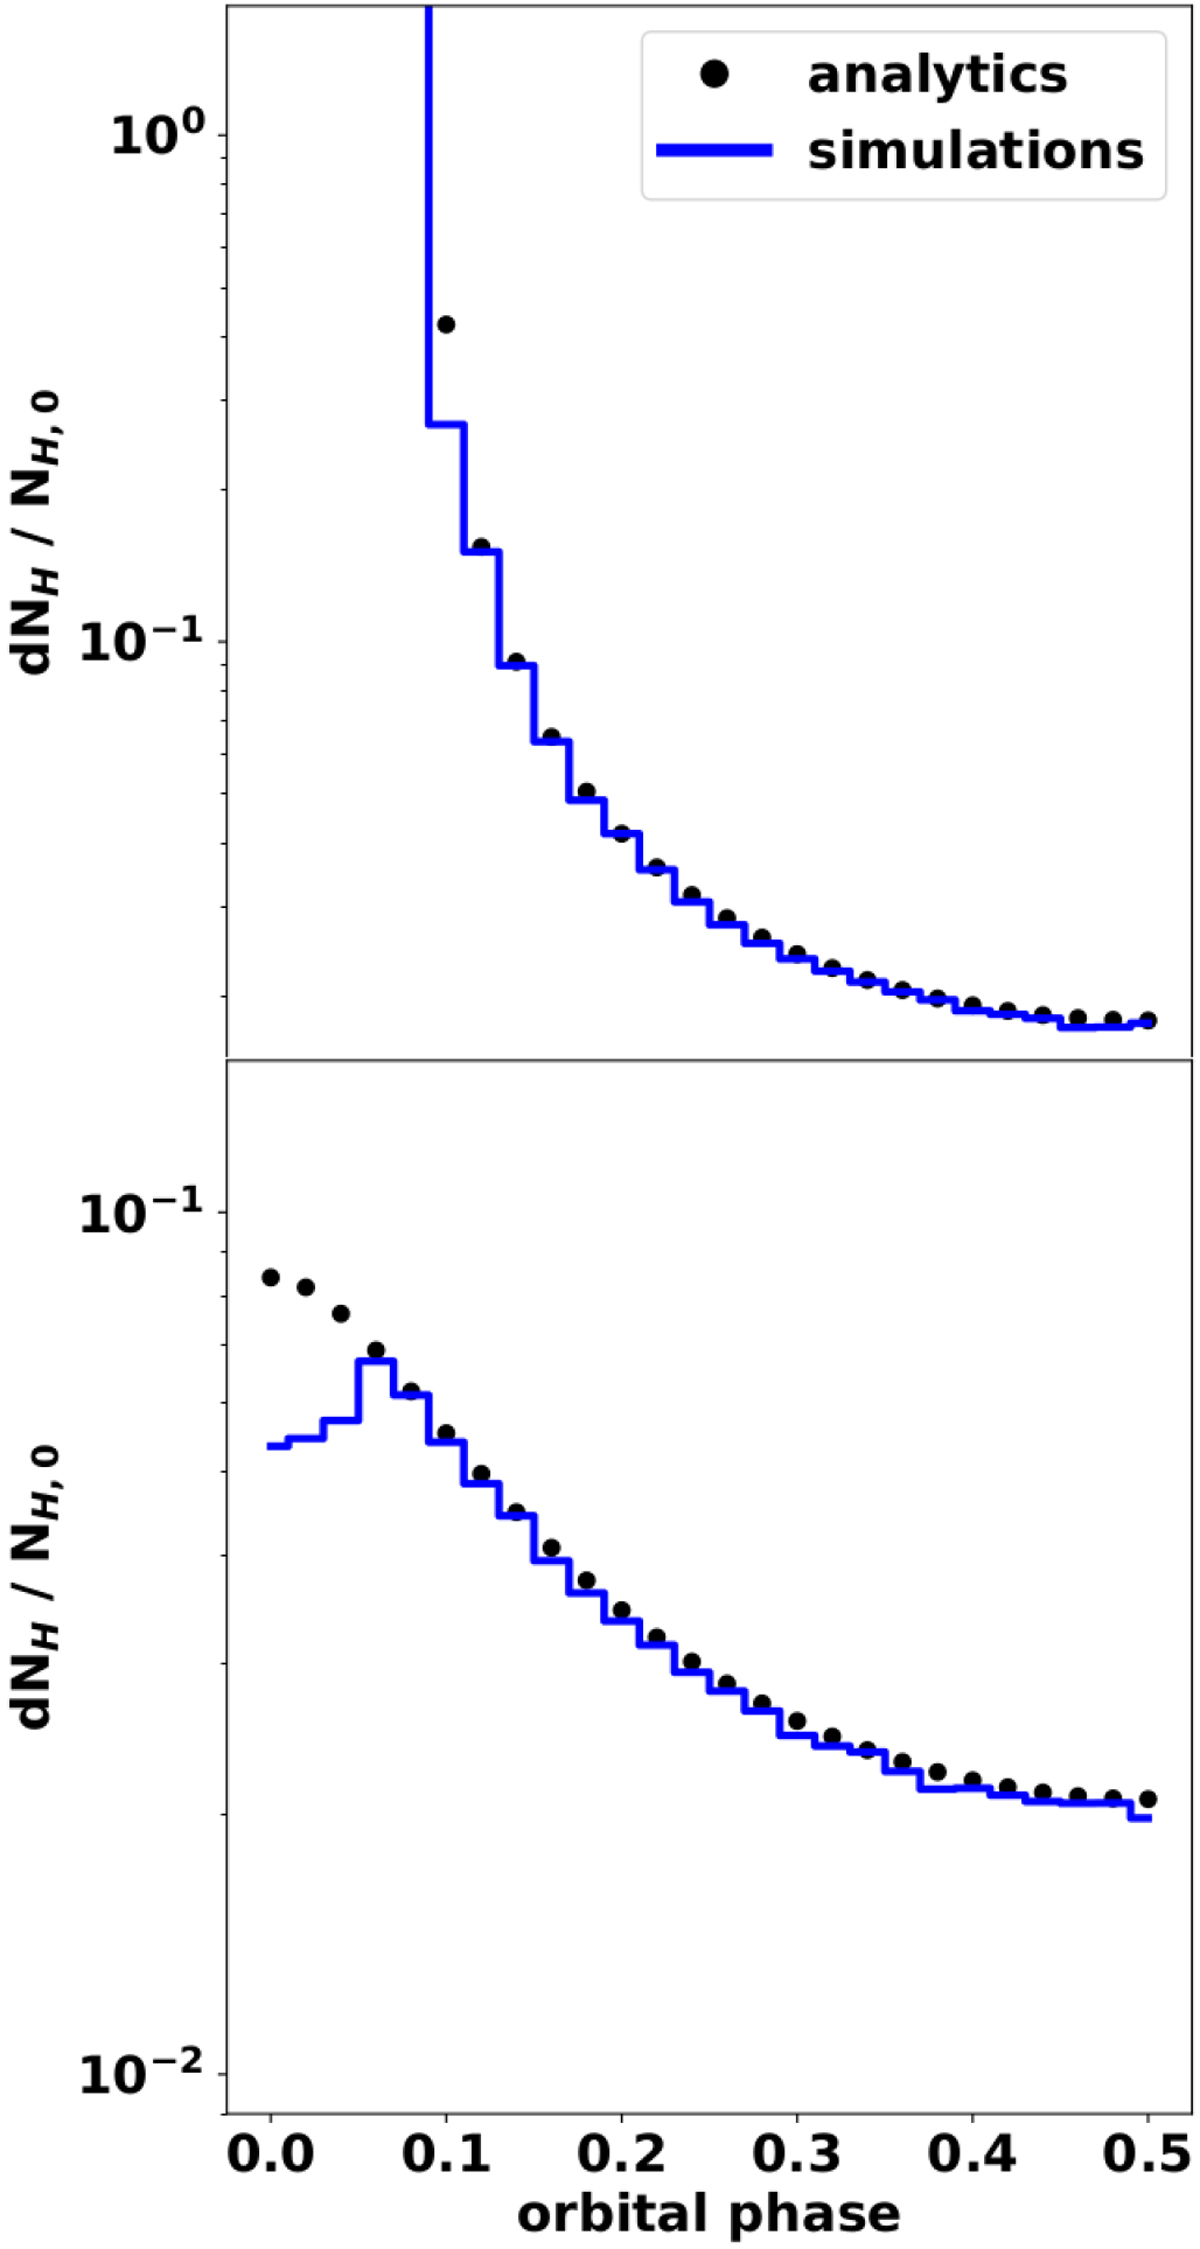
Standard deviation of the column density as a function of the orbital phase computed numerically (in blue) and analytically (black dots) for simulations with mcl = 10−5, Rcl = 0.02. Top panel; β = 2, a = 2 and i = 90° and bottom panel: β = 0.5, a = 1.6 and i = 45°. The discrepancy at low orbital phase is partly indicative of the region near the stellar photosphere where the wind in the numerical model is assumed to not be clumpy yet.
Current usage metrics show cumulative count of Article Views (full-text article views including HTML views, PDF and ePub downloads, according to the available data) and Abstracts Views on Vision4Press platform.
Data correspond to usage on the plateform after 2015. The current usage metrics is available 48-96 hours after online publication and is updated daily on week days.
Initial download of the metrics may take a while.