Fig. 9.
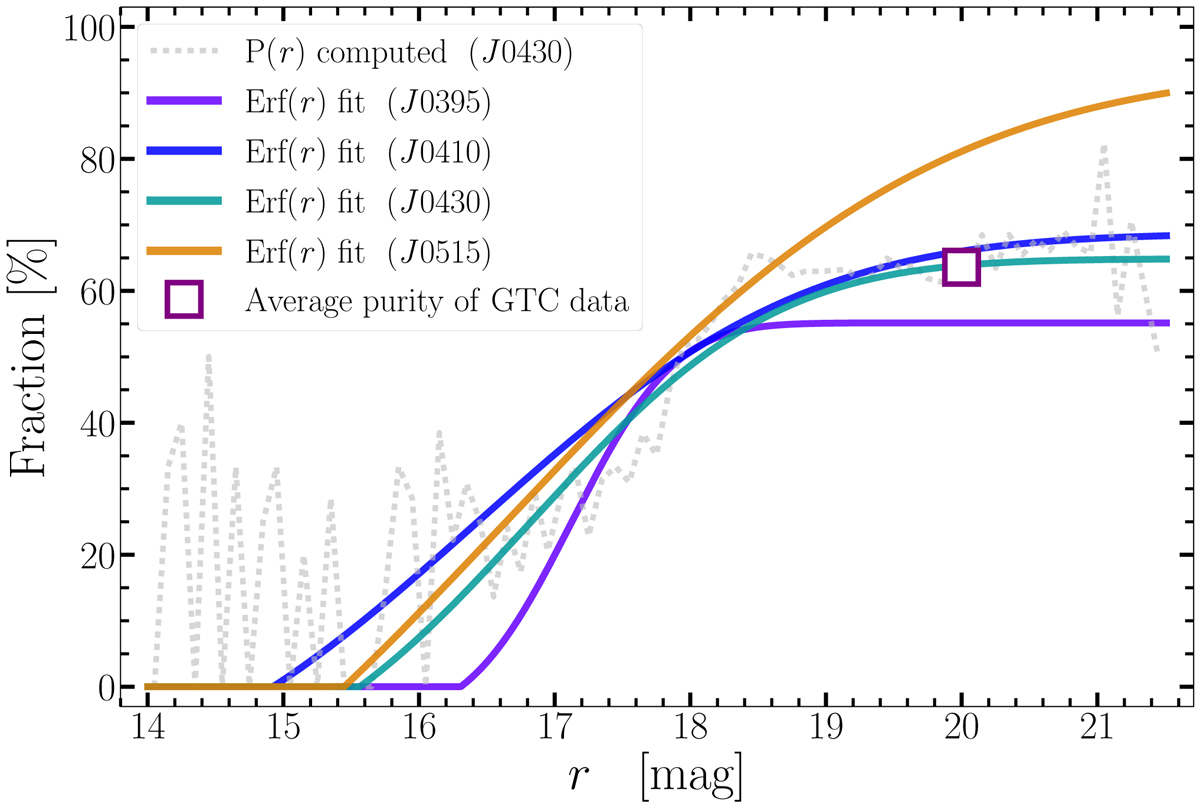
Statistical purity weight for each NB (coloured solid lines) as estimated by fitting an error-function to the computed purity. The grey-dotted line shows the computed purity of J0430 NB as an example. All filters show similar purity weights, rising to ≳60% at r ≳ 18.5. This is in agreement with the average purity of our 45 spectroscopic targets (Sect. 3.4.2) which is shown as a purple empty square.
Current usage metrics show cumulative count of Article Views (full-text article views including HTML views, PDF and ePub downloads, according to the available data) and Abstracts Views on Vision4Press platform.
Data correspond to usage on the plateform after 2015. The current usage metrics is available 48-96 hours after online publication and is updated daily on week days.
Initial download of the metrics may take a while.