Fig. 7.
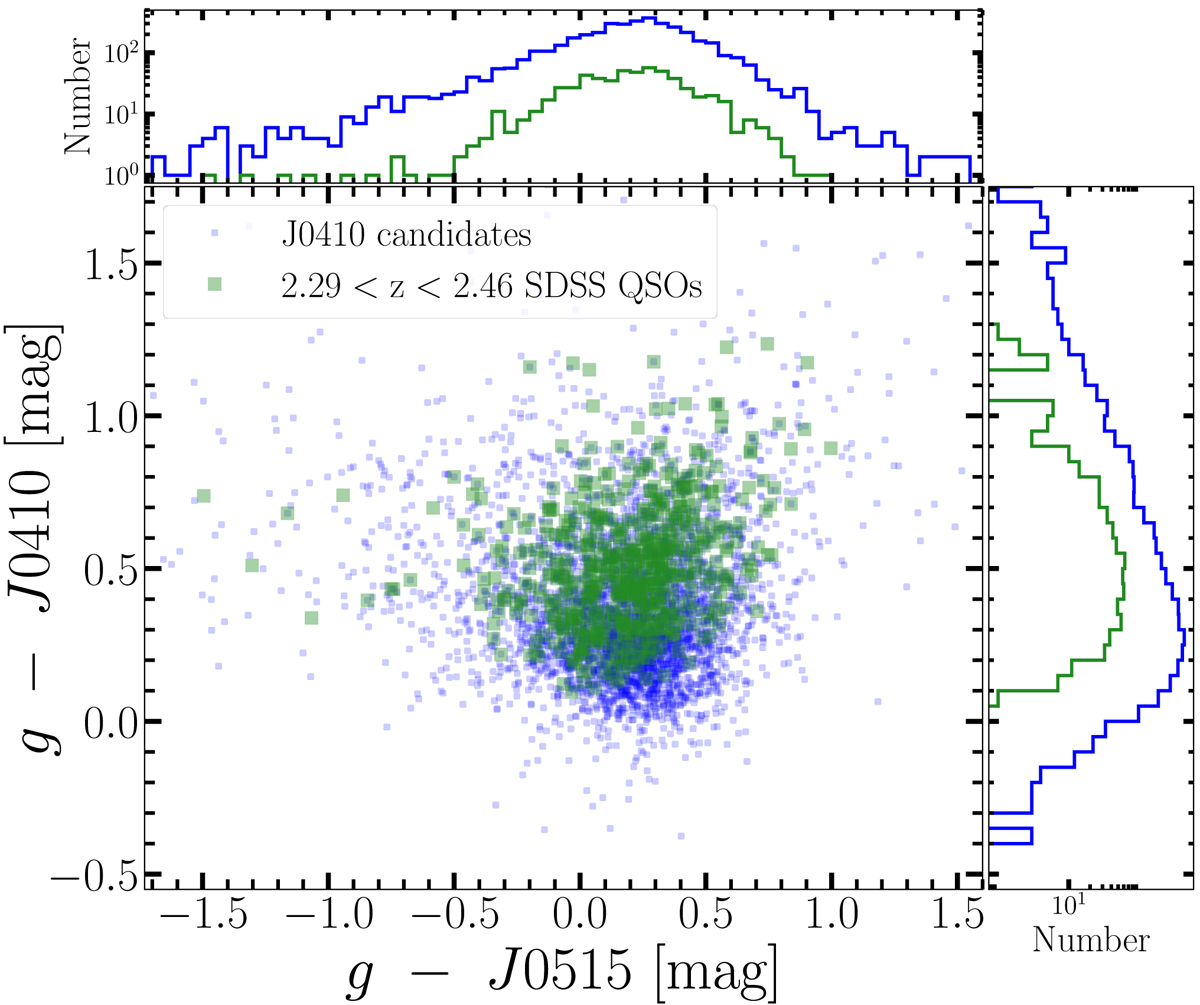
Comparison between the colour–colour distributions of DR14 QSOs (green squares) within our J0410 sample and of the remaining J0410 genuine candidates (blue dots, after removing known interlopers; Sect. 3.3). The two source classes occupy comparable colour regions, suggesting that our selection results might be effectively dominated by z ∼ 2.3 AGN/QSOs. This scenario is also supported by the results of our spectroscopic program (Sect. 3.4).
Current usage metrics show cumulative count of Article Views (full-text article views including HTML views, PDF and ePub downloads, according to the available data) and Abstracts Views on Vision4Press platform.
Data correspond to usage on the plateform after 2015. The current usage metrics is available 48-96 hours after online publication and is updated daily on week days.
Initial download of the metrics may take a while.