Fig. 6.
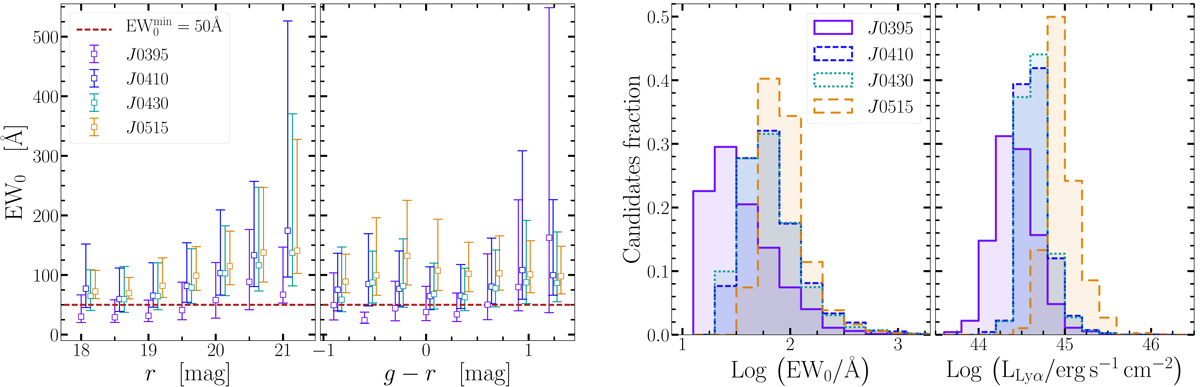
Left figure: EW0 distribution of our selected candidates as a function of r and g − r colour (left and right panels, respectively). Squared points and error bars show respectively the distribution median and 16th–84th percentiles in each magnitude and colour bin. Points have been artificially shifted for better visualisation. The values for J0395 filter at r < 20 (g − r < 0.75) are systematically below the theoretical ![]() cut we apply (Sect. 3.2). This is due to the small overlap between this NB and the g BB, which is reflected in a poor extrapolation of the linear continuum at the NB filter pivot wavelength (see e.g. Ouchi et al. 2008, and the discussion in Sect. 3.2). Right figure: normalised distributions of our candidates in EW and Lyα luminosity for each filter. This result clearly shows that filters sampling higher redshifts also sample brighter Lyα luminosity. This is a direct effect of J-PLUS detection limits which only allow to observe brighter and rare objects at higher redshifts. We address this issue by applying the completeness corrections described in Sect. 4.4.
cut we apply (Sect. 3.2). This is due to the small overlap between this NB and the g BB, which is reflected in a poor extrapolation of the linear continuum at the NB filter pivot wavelength (see e.g. Ouchi et al. 2008, and the discussion in Sect. 3.2). Right figure: normalised distributions of our candidates in EW and Lyα luminosity for each filter. This result clearly shows that filters sampling higher redshifts also sample brighter Lyα luminosity. This is a direct effect of J-PLUS detection limits which only allow to observe brighter and rare objects at higher redshifts. We address this issue by applying the completeness corrections described in Sect. 4.4.
Current usage metrics show cumulative count of Article Views (full-text article views including HTML views, PDF and ePub downloads, according to the available data) and Abstracts Views on Vision4Press platform.
Data correspond to usage on the plateform after 2015. The current usage metrics is available 48-96 hours after online publication and is updated daily on week days.
Initial download of the metrics may take a while.