Fig. 5.
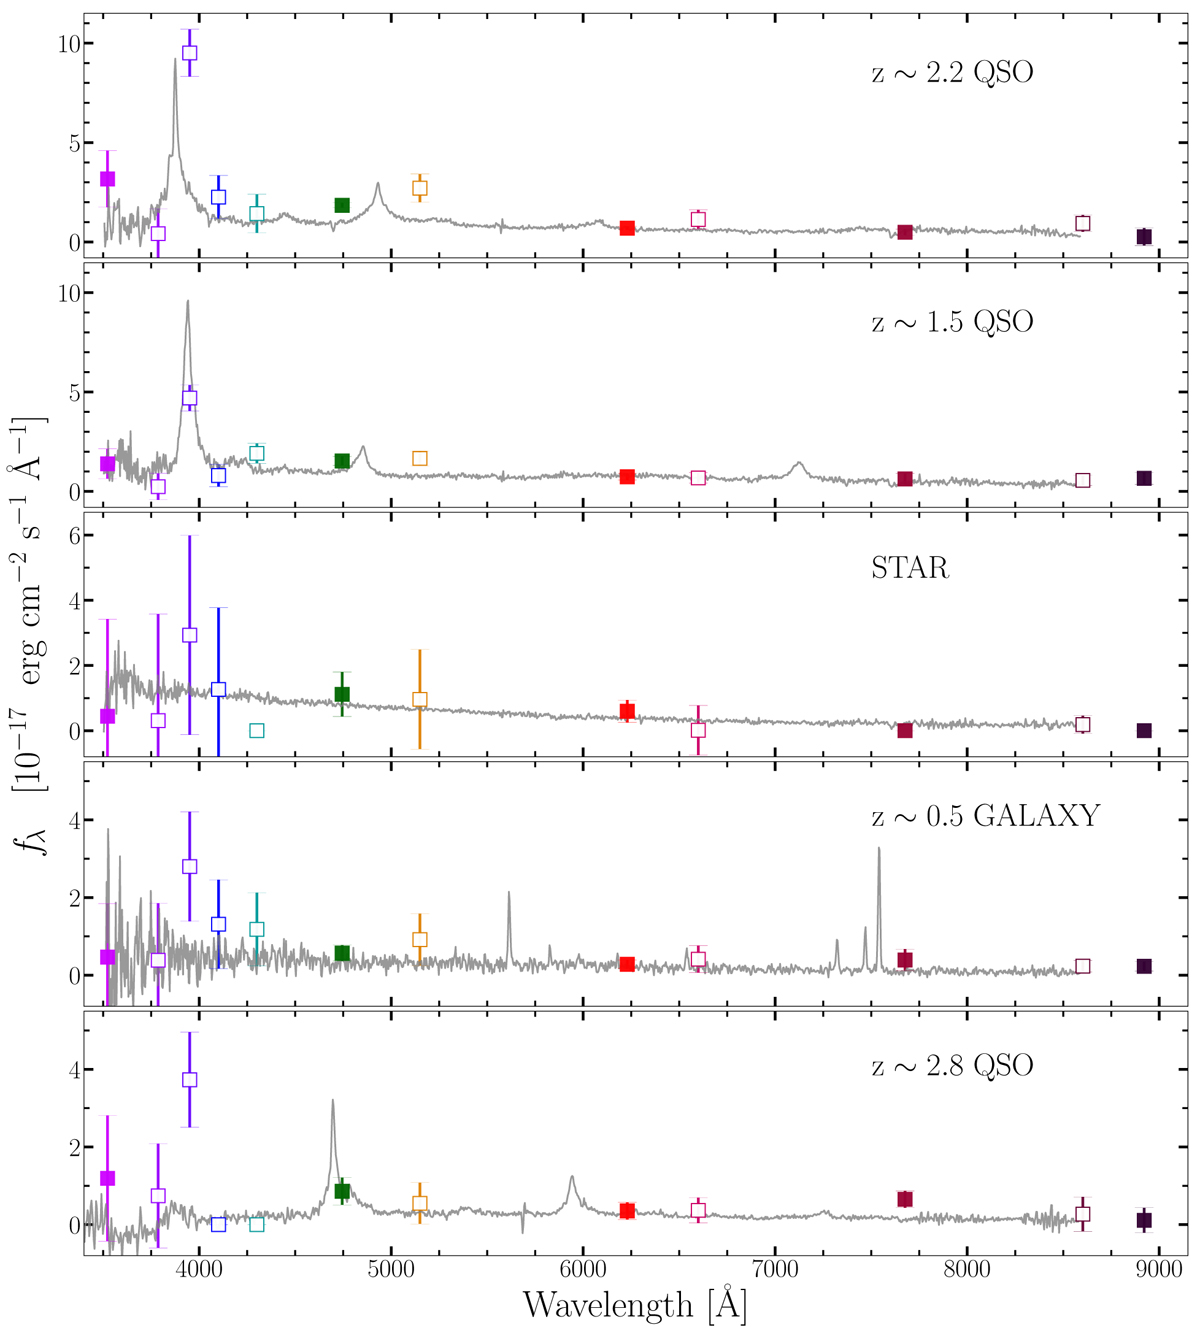
Summary of our spectroscopic results showing one spectrum (grey line in each panel) for each source class identified in our target lists. From top to bottom: z ∼ 2.2 QSO, z ∼ 1.5 QSO, star, z ∼ 0.5 galaxy, and Lyβ-emitting QSO. The corresponding J-PLUS photometry is shown as coloured squares. The star and galaxy targets show low-significance excesses in J0395 NB (third square from the left). Indeed, these interlopers were selected as targets by the first version of our methodology, i.e. before applying the improvements due to CTG2018A results and the re-calibration of J-PLUS data (López-Sanjuan et al. 2019a).
Current usage metrics show cumulative count of Article Views (full-text article views including HTML views, PDF and ePub downloads, according to the available data) and Abstracts Views on Vision4Press platform.
Data correspond to usage on the plateform after 2015. The current usage metrics is available 48-96 hours after online publication and is updated daily on week days.
Initial download of the metrics may take a while.