Fig. 4.
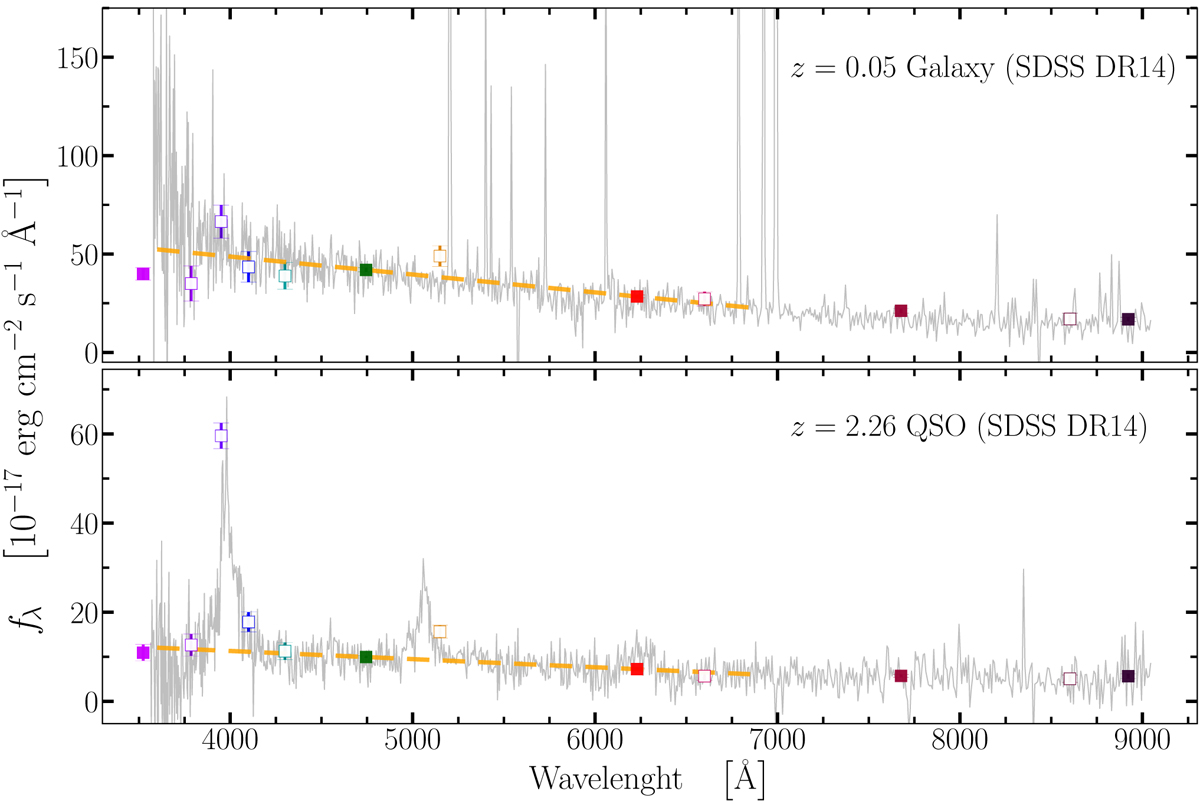
Examples of multiple NB excess in J-PLUS photo spectra. Empty and filled squares mark NB and BB photometry, respectively, while the dashed yellow line shows the linear continuum we estimate through g and r BBs (in green and red, respectively). This comparison shows that both a z ∼ 0.05 galaxy (upper panel) and a z ∼ 2.25 QSO (lower panel) exhibit significant excesses in J0395 and J0515 NBs (second and fifth empty squares from the left, respectively). The J0515 excess is produced by H β at z ∼ 0.05 and the CIV line at z ∼ 2.25, but its nature is hardly distinguishable using J-PLUS photometry.
Current usage metrics show cumulative count of Article Views (full-text article views including HTML views, PDF and ePub downloads, according to the available data) and Abstracts Views on Vision4Press platform.
Data correspond to usage on the plateform after 2015. The current usage metrics is available 48-96 hours after online publication and is updated daily on week days.
Initial download of the metrics may take a while.