Fig. 3.
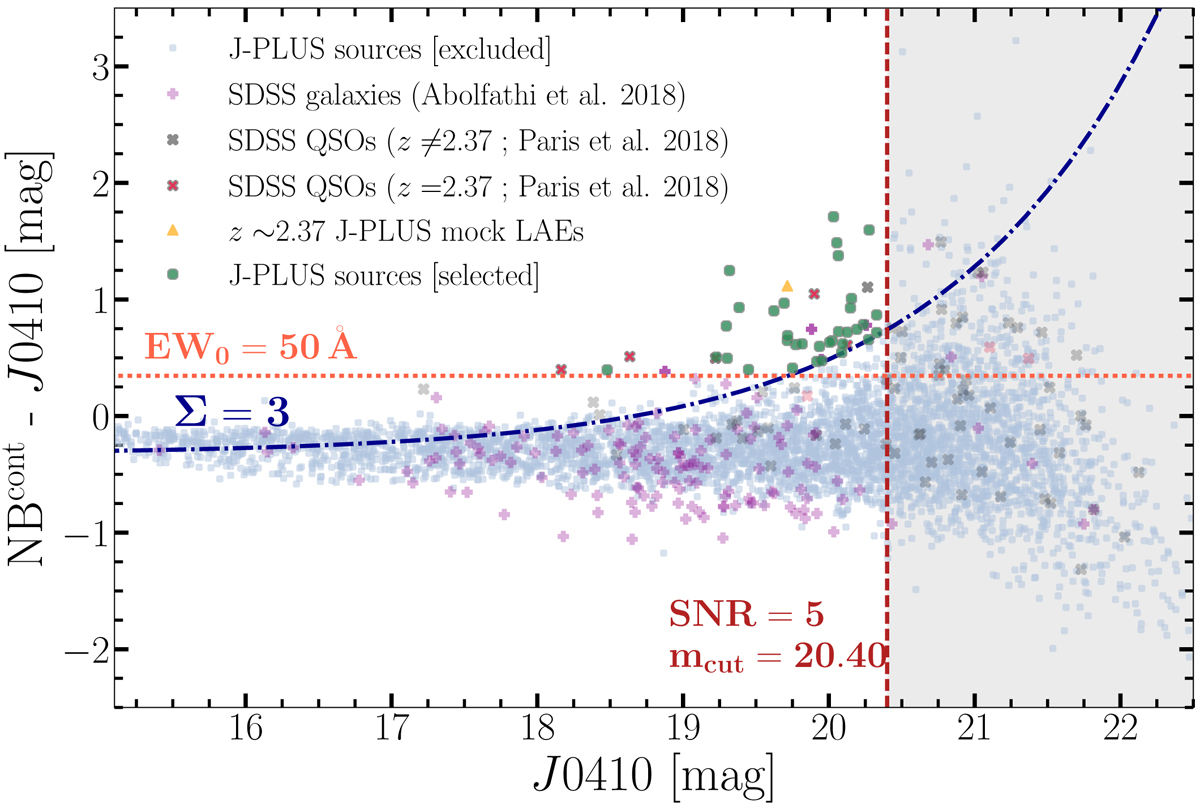
Example of a colour-magnitude diagram obtained for the NB filter J0410 on a DR1 pointing (out of 511). Our photometric cuts are summarised as follows: the blue dashed-dotted line shows the ΔmNB-significance threshold, while the vertical red line marks the NB S/N limit. We exclude sources below the blue dashed-dotted line and inside the grey shaded area. The orange horizontal dotted line shows ΔmNB associated to EW = 50 Å (see Eq. (7)). Grey-blue dots mark all the J-PLUS detections in the pointing, while red and purple crosses show z ∼ 2.4 QSOs and low-z galaxies from SDSS DR14. Yellow triangles show J-PLUS mock data of z ∼ 2.4 SF LAEs (Izquierdo-Villalba et al. 2019). Finally, our Lyα-emitting candidates are shown as green dots.
Current usage metrics show cumulative count of Article Views (full-text article views including HTML views, PDF and ePub downloads, according to the available data) and Abstracts Views on Vision4Press platform.
Data correspond to usage on the plateform after 2015. The current usage metrics is available 48-96 hours after online publication and is updated daily on week days.
Initial download of the metrics may take a while.