Fig. D.1.
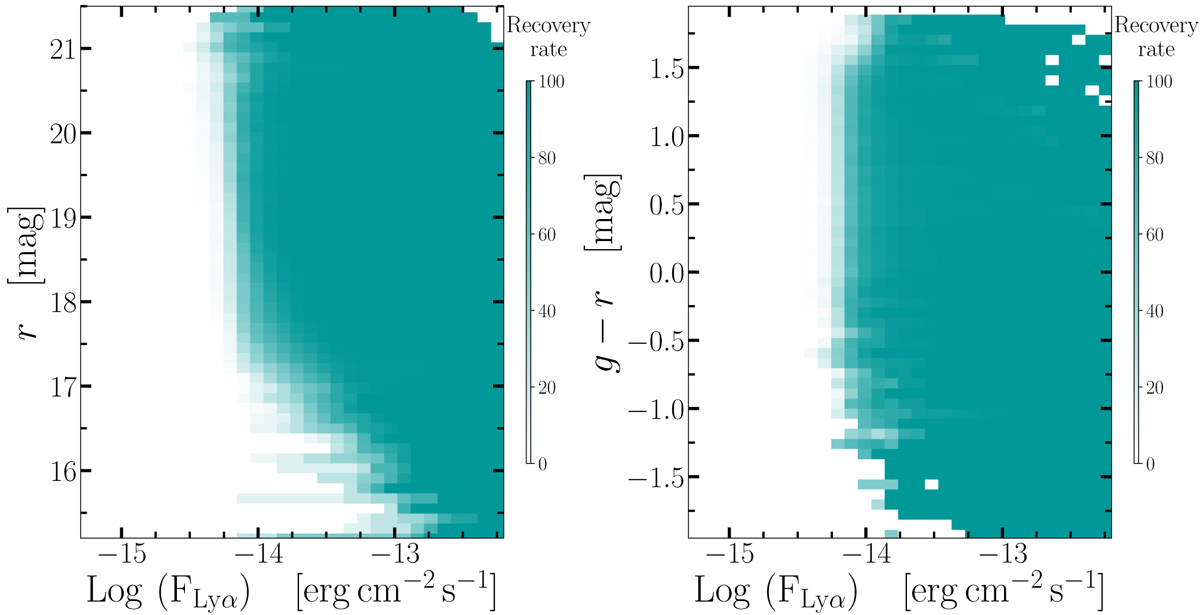
3D grid of recovery rates for the J0430 filter shown as an example. Left and right panels respectively show the projections of recovery rates in the Lyα flux vs. r plane and Lyα flux vs. g − r plane. We note that the recovery rates show noisy values at r < 17 and g − r < − 1.25 due to the low number of sources in these magnitude and colour bins. Nevertheless, these regions of the 3D parameter space are excluded from the LF computation by the purity weight (Sect. 4.3).
Current usage metrics show cumulative count of Article Views (full-text article views including HTML views, PDF and ePub downloads, according to the available data) and Abstracts Views on Vision4Press platform.
Data correspond to usage on the plateform after 2015. The current usage metrics is available 48-96 hours after online publication and is updated daily on week days.
Initial download of the metrics may take a while.