Fig. C.3.
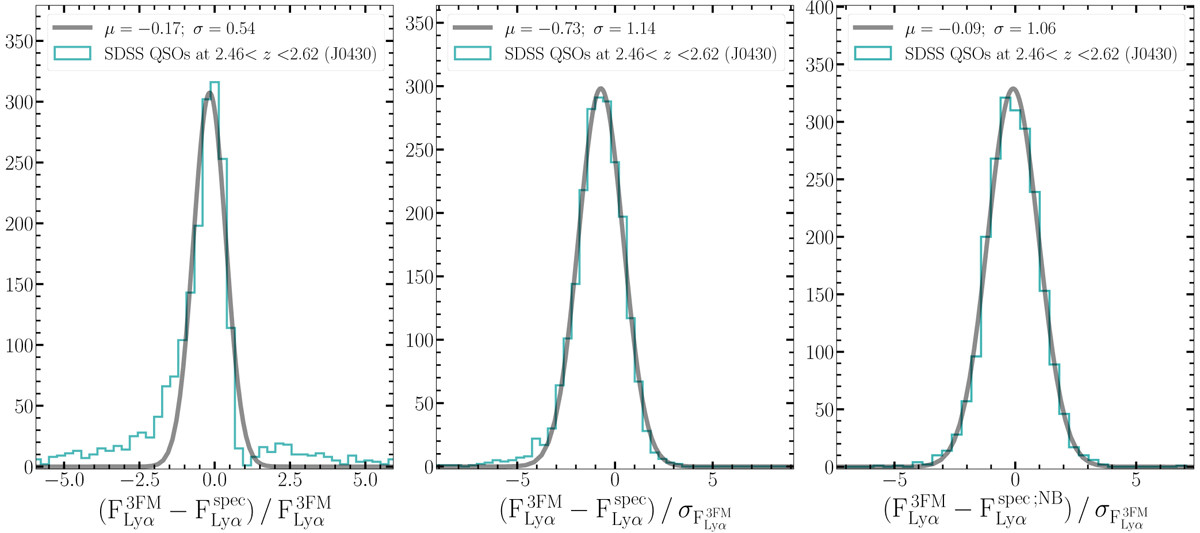
Cyan solid lines in all panels show the histograms of differences between line flux measurements performed on J-PLUS photometry (Sect. 3.1) and on SDSS spectroscopy (Fig. C.1), for the case of J0430. The difference between ![]() and
and ![]() is normalised respectively by
is normalised respectively by ![]() and by
and by ![]() in the left and middle panels. We use the systematic shift of the distributions in the left panel to statistically correct
in the left and middle panels. We use the systematic shift of the distributions in the left panel to statistically correct ![]() (see Sect. 4.1.2). The spread of the distribution in the middle panel, on the other hand, allows the rescaling of the uncertainty associated with
(see Sect. 4.1.2). The spread of the distribution in the middle panel, on the other hand, allows the rescaling of the uncertainty associated with ![]() measurements in order to account for residual statistical errors not included in
measurements in order to account for residual statistical errors not included in ![]() . Section 4.4.4 details how we make use of the corrected
. Section 4.4.4 details how we make use of the corrected ![]() and
and ![]() in the computation of the errors associated to our final LFs. Finally, right panel shows that
in the computation of the errors associated to our final LFs. Finally, right panel shows that ![]() well compares to the spectroscopic measure
well compares to the spectroscopic measure ![]() .
.
Current usage metrics show cumulative count of Article Views (full-text article views including HTML views, PDF and ePub downloads, according to the available data) and Abstracts Views on Vision4Press platform.
Data correspond to usage on the plateform after 2015. The current usage metrics is available 48-96 hours after online publication and is updated daily on week days.
Initial download of the metrics may take a while.