Fig. 2.
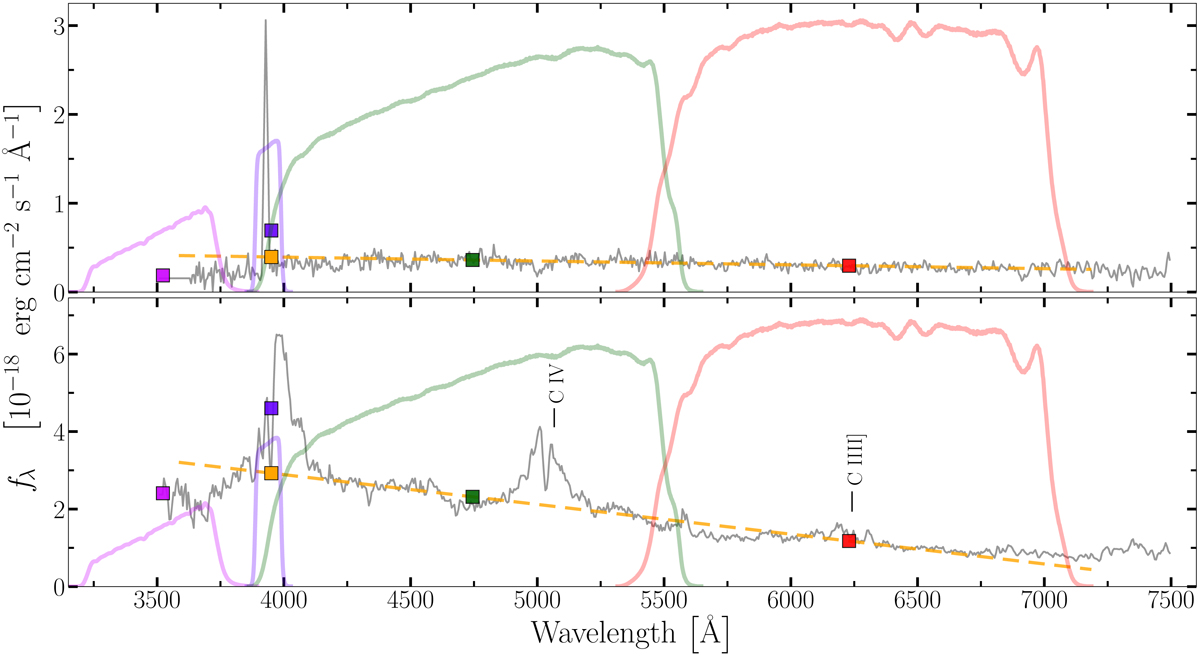
Representation of our NB excess detection method. Grey lines in both panels show the observed spectra of typical z ∼ 2 Lyα-emitting sources (from the publicly available VUDS DR1 spectroscopic dataset, see e.g. Le Fèvre et al. 2015; Tasca et al. 2017). Upper panel: SF LAE spectrum showing a single prominent Lyα line (here redshifted at λobs ∼ 3900 Å) and no other significant features. Bottom panel: QSO spectrum with evident CIV and CIII] lines in addition to Lyα (at λobs ∼ 4000 Å). We show the transmission curves and associated synthetic photometry of four J-PLUS bands as coloured lines and squares. From left to right: u (purple), J0395 NB (violet), g (green), and r (red). The additional lines of this caption were moved to Sect. 3.1
Current usage metrics show cumulative count of Article Views (full-text article views including HTML views, PDF and ePub downloads, according to the available data) and Abstracts Views on Vision4Press platform.
Data correspond to usage on the plateform after 2015. The current usage metrics is available 48-96 hours after online publication and is updated daily on week days.
Initial download of the metrics may take a while.