Fig. C.2.
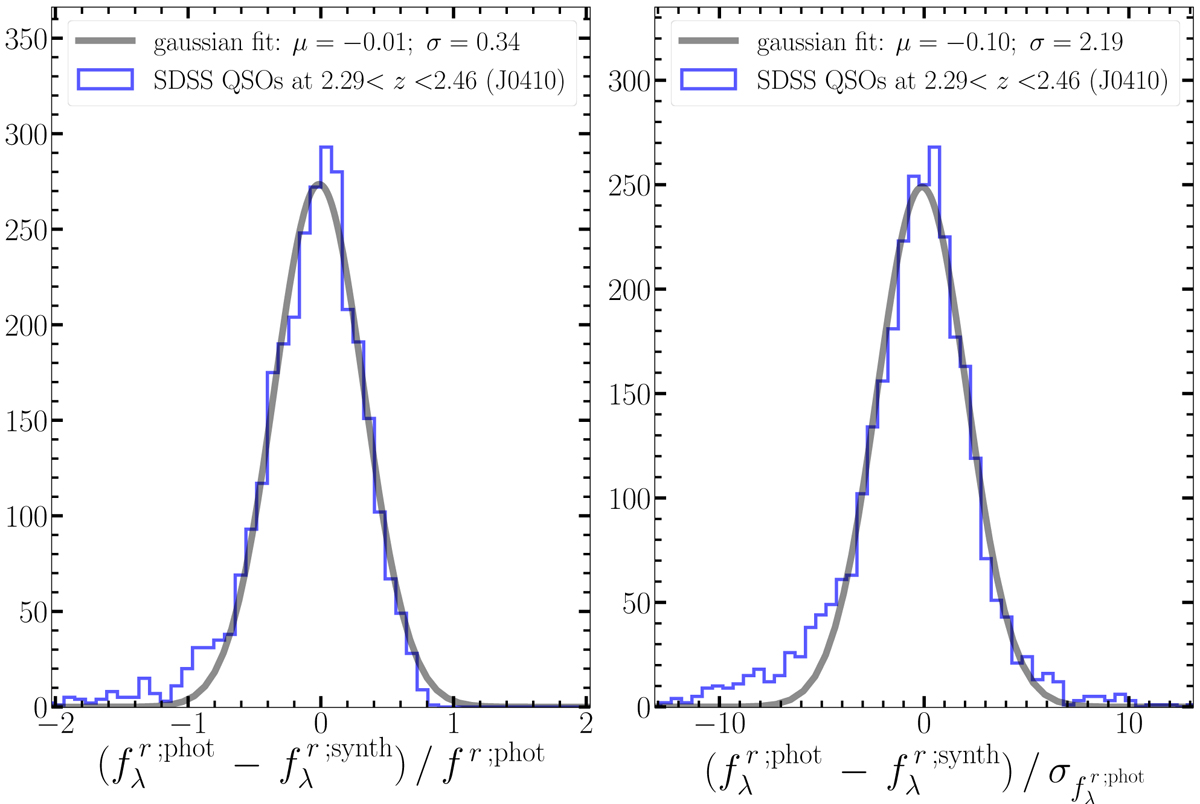
Blue solid lines in both panels show the histograms of the difference between J-PLUS r flux (i.e. ![]() ) and
) and ![]() obtained from SDSS QSOs spectra (see Fig. C.1). The distributions are normalised by respectively
obtained from SDSS QSOs spectra (see Fig. C.1). The distributions are normalised by respectively ![]() (left panel) and its photometric error
(left panel) and its photometric error ![]() (right panel). Both distributions are centred at zero (see plot legends), meaning that
(right panel). Both distributions are centred at zero (see plot legends), meaning that ![]() and
and ![]() values are statistically equivalent. On the other hand, the distribution spread in the right panel is significantly bigger than one, and therefore photometric errors do not fully account for the flux difference. Consequently, we re-scale
values are statistically equivalent. On the other hand, the distribution spread in the right panel is significantly bigger than one, and therefore photometric errors do not fully account for the flux difference. Consequently, we re-scale ![]() to the value obtained by the Gaussian fit (right-panel legend).
to the value obtained by the Gaussian fit (right-panel legend).
Current usage metrics show cumulative count of Article Views (full-text article views including HTML views, PDF and ePub downloads, according to the available data) and Abstracts Views on Vision4Press platform.
Data correspond to usage on the plateform after 2015. The current usage metrics is available 48-96 hours after online publication and is updated daily on week days.
Initial download of the metrics may take a while.