Fig. C.1.
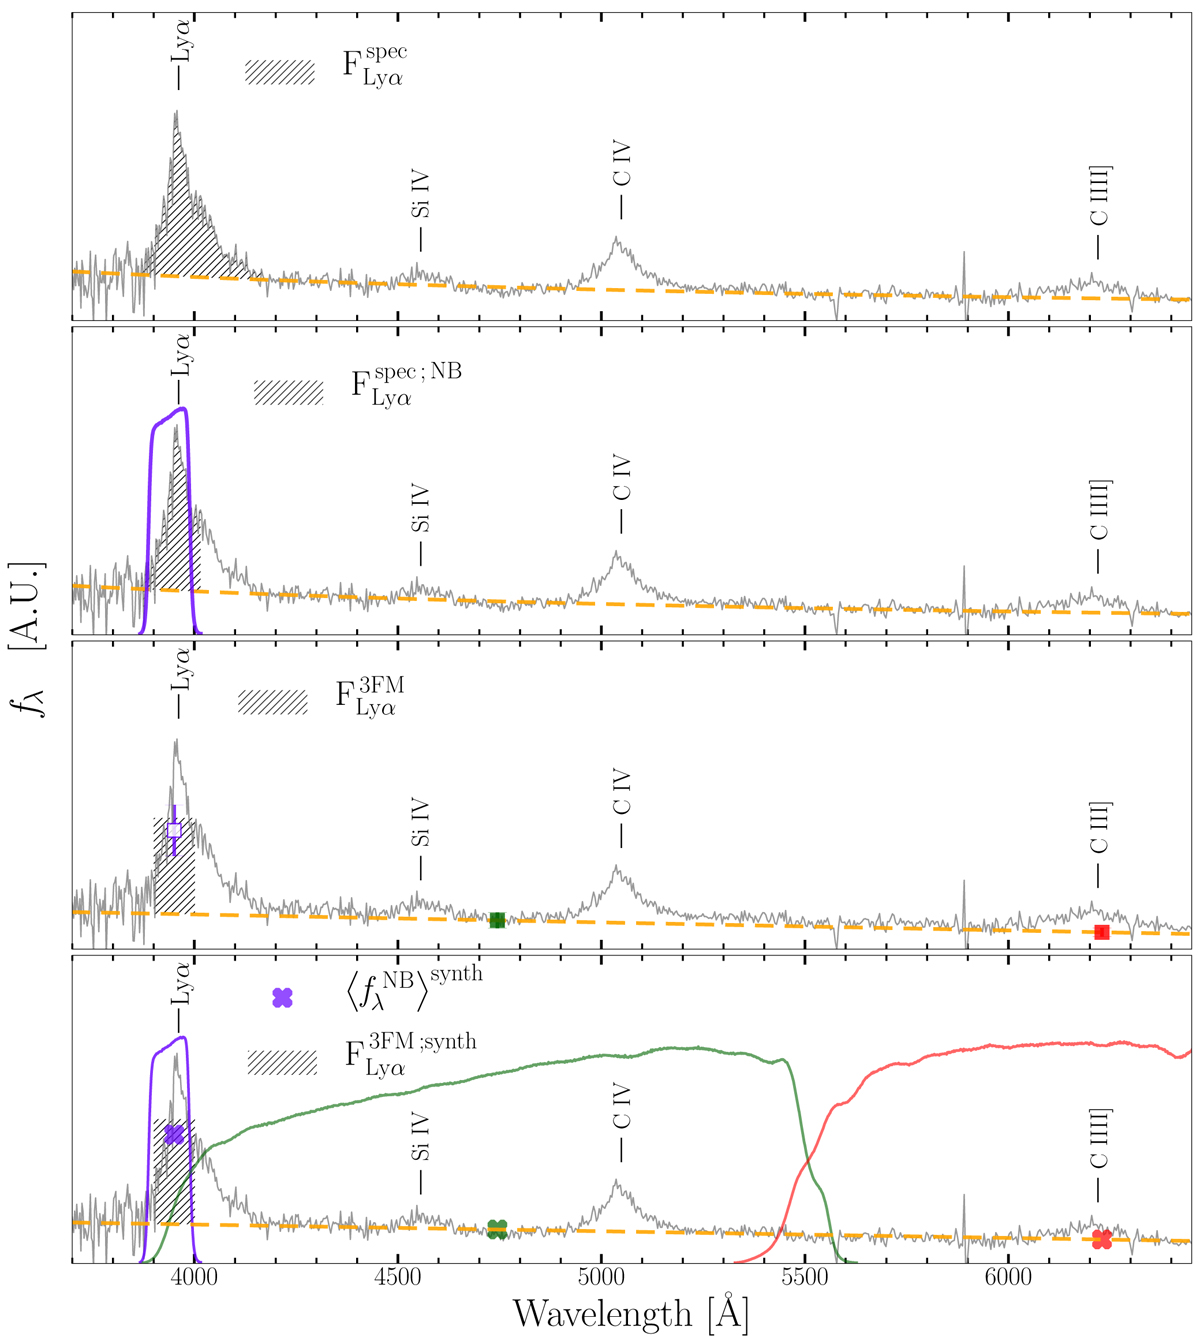
Graphic definition of the quantities used for comparing Lyα flux. The spectrum of a z ∼ 2.2 QSO from SDSS DR14 is used as example in all panels (grey lines). Each Lyα flux definition is outlined by a grey shaded area (see text for details). Yellow lines in each panel show the reconstruction of the source continuum (power-law and linear approximation, respectively, in the first two and last two panels from the top). Finally, coloured squares and crosses (third and last panel from the top, respectively) show J-PLUS measurements and synthetic photometry, respectively, performed on the SDSS spectrum with J-PLUS transmission curves (Eq. (A.2)).
Current usage metrics show cumulative count of Article Views (full-text article views including HTML views, PDF and ePub downloads, according to the available data) and Abstracts Views on Vision4Press platform.
Data correspond to usage on the plateform after 2015. The current usage metrics is available 48-96 hours after online publication and is updated daily on week days.
Initial download of the metrics may take a while.