Fig. 15.
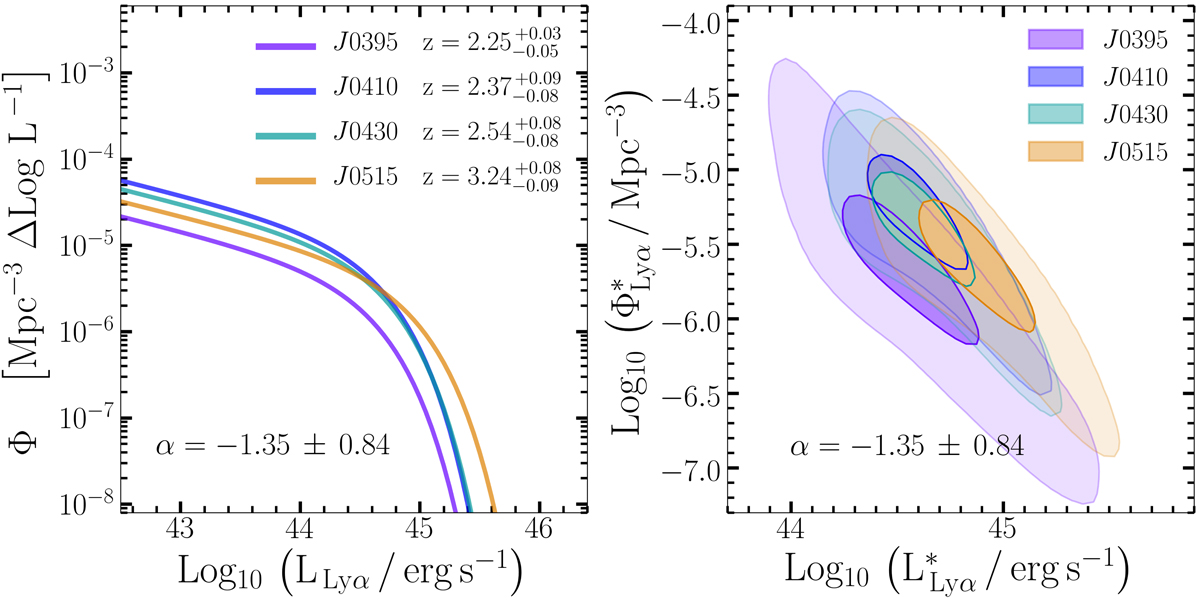
Left panel: single-Schechter fits to our data computed with the fixed faint-end slope α = − 1.35 ± 0.84 obtained as in Sect. 5.3.1. We note that the differences among the four determinations (factor of about two in both luminosity and normalisation) are absorbed by the errors on the Schechter parameters (right panel). Right panel: distribution of Φ* and L* obtained from the Monte-Carlo sampling of α errors. The contours mark the levels including 86% and 39% of the Monte-Carlo realisations (faint and dark contours, respectively). This analysis shows that the parameters of the four determinations are statistically consistent; we do not observe hints for an evolution of the 2 ≲ z ≲ 3.3 Lyα LF at Log(LLyα/erg s−1) ≳ 43.5.
Current usage metrics show cumulative count of Article Views (full-text article views including HTML views, PDF and ePub downloads, according to the available data) and Abstracts Views on Vision4Press platform.
Data correspond to usage on the plateform after 2015. The current usage metrics is available 48-96 hours after online publication and is updated daily on week days.
Initial download of the metrics may take a while.