Fig. 11.
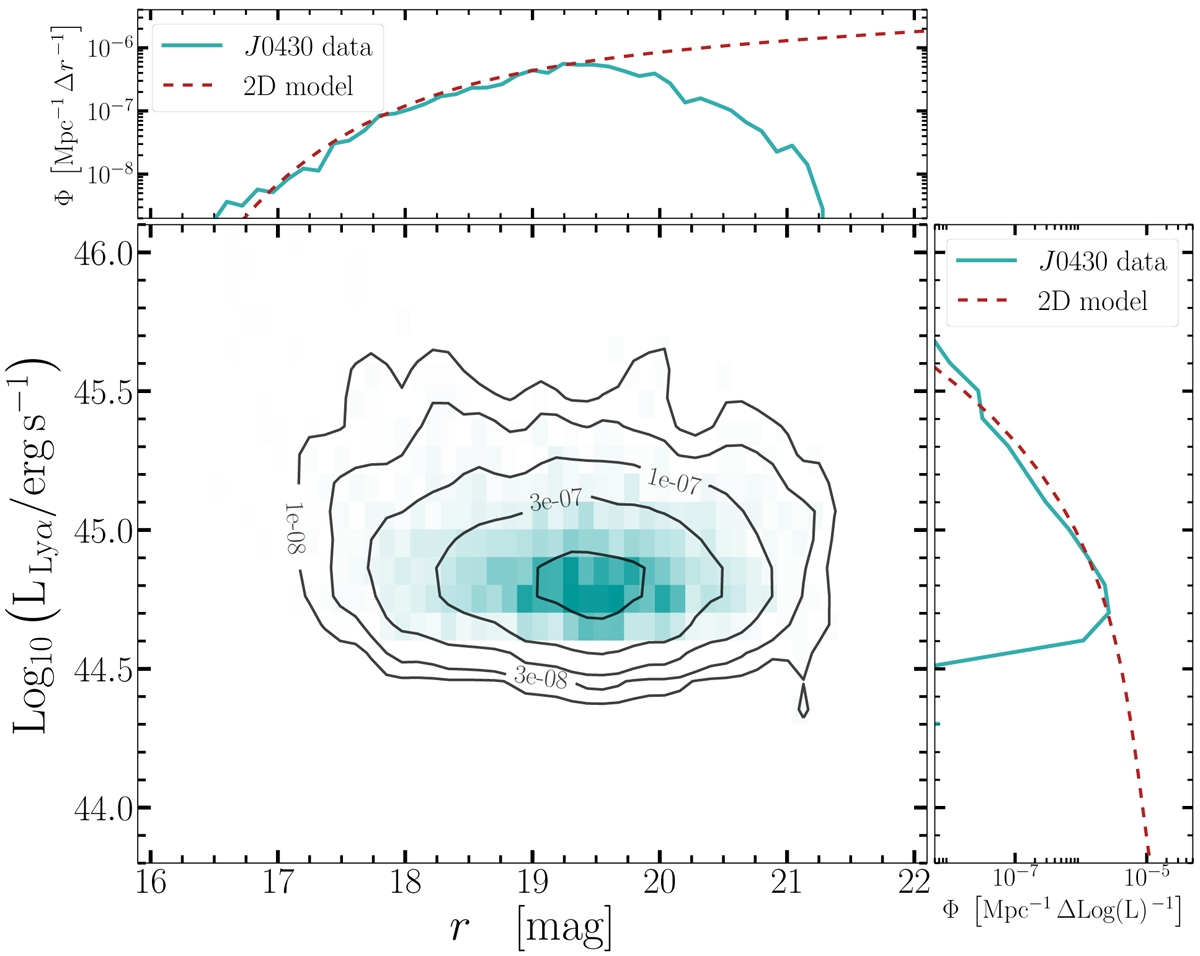
Central panel: full 2D luminosity function of our J0430 candidates as a function of r and Log(LLyα). Green solid lines in the top and right panels show the projections of the 2D LF along the Log(LLyα) and r axes, respectively. The red dashed lines show the projection of the 2D model along the same axes. This model was fitted to the 2D distribution shown in the central panel (see Appendix D for computational details) and allows us to extrapolate our data distribution at faint r and Lyα luminosity. We use the data-to-model ratio (in the r vs. Log(LLyα) 2D plane) to compute the ![]() weight of each candidate.
weight of each candidate.
Current usage metrics show cumulative count of Article Views (full-text article views including HTML views, PDF and ePub downloads, according to the available data) and Abstracts Views on Vision4Press platform.
Data correspond to usage on the plateform after 2015. The current usage metrics is available 48-96 hours after online publication and is updated daily on week days.
Initial download of the metrics may take a while.