Fig. 6.
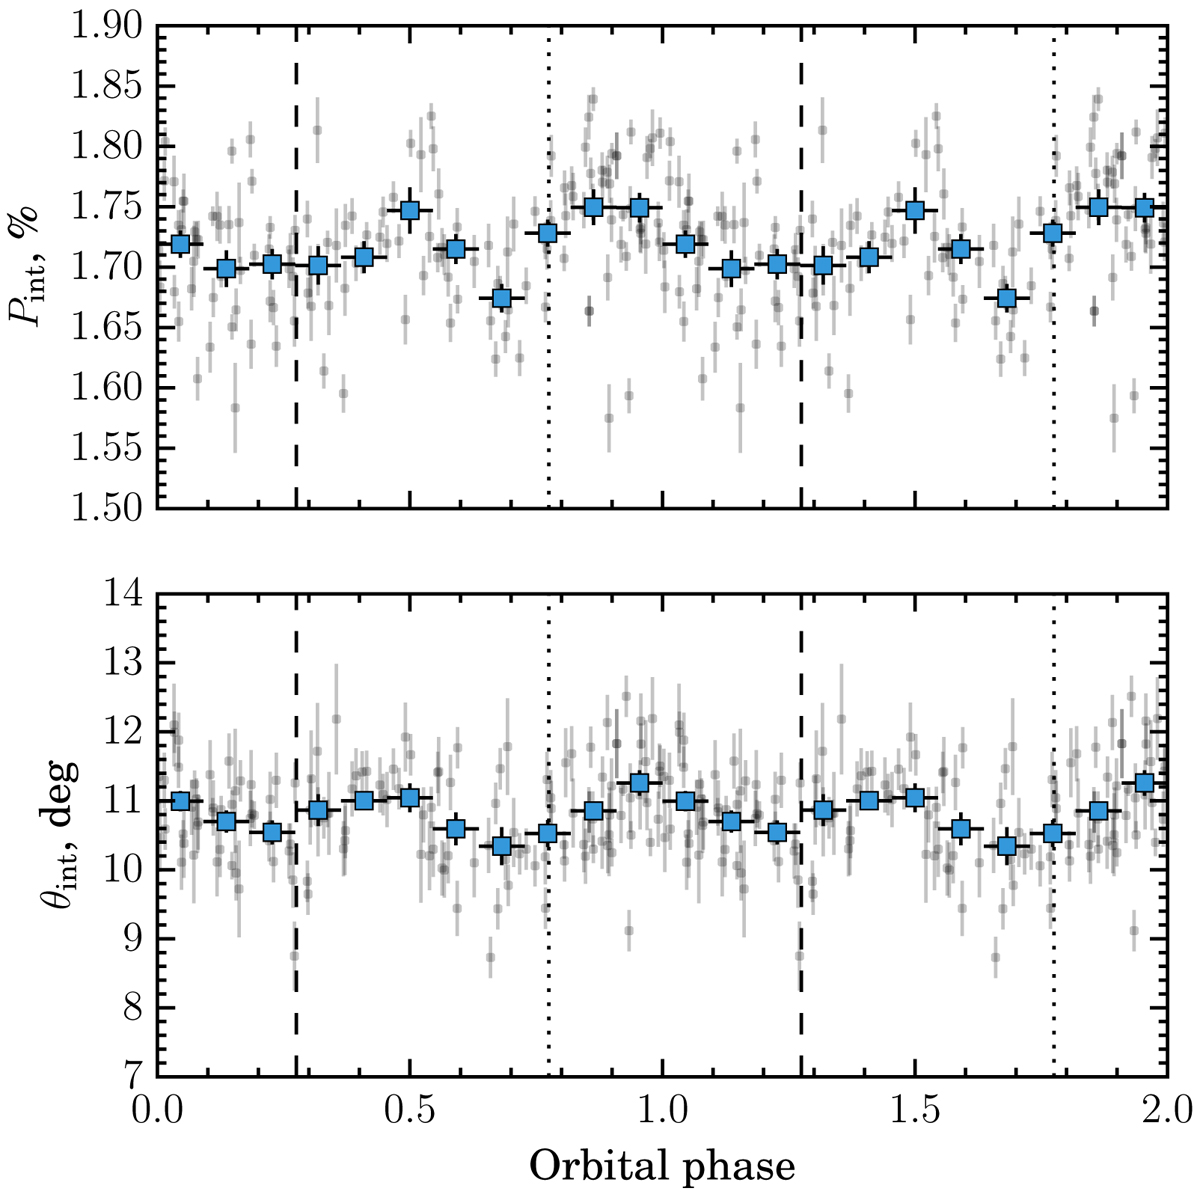
Orbital variability of intrinsic PD Pint and PA θint of LS I +61° 303 in V band. The filled blue squares with 1σ errors correspond to the average values of the individual observations (represented by gray circles with error bars) and the standard errors of the mean calculated within the phase bins of width Δϕ = 0.091. The vertical dashed lines correspond to the phases of periastron (ϕ = 0.275) and apastron (ϕ = 0.775) as derived by Aragona et al. (2009).
Current usage metrics show cumulative count of Article Views (full-text article views including HTML views, PDF and ePub downloads, according to the available data) and Abstracts Views on Vision4Press platform.
Data correspond to usage on the plateform after 2015. The current usage metrics is available 48-96 hours after online publication and is updated daily on week days.
Initial download of the metrics may take a while.