Fig. 1.
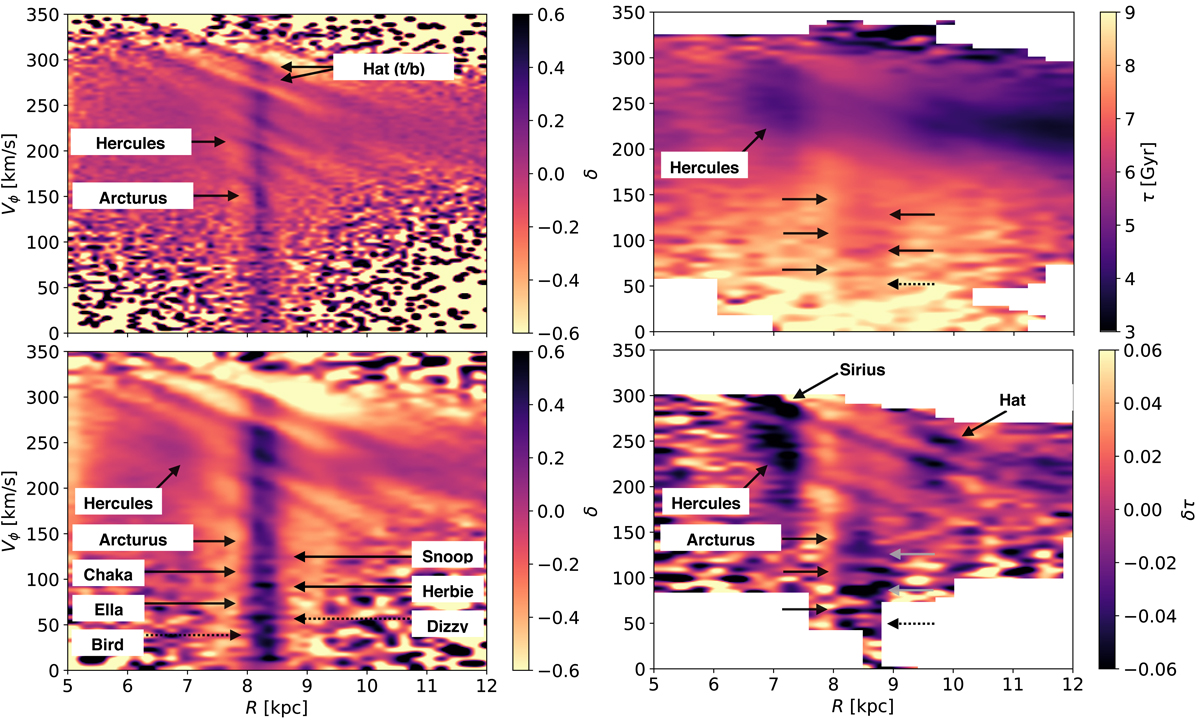
Top left: unsharp masked δ(vϕ − R) plane for the Gaia DR2 and Sanders & Das (2018) master catalog (∼9 million sources with 6D phase-space information). The bin size is (ΔR, Δvϕ) = (0.1 kpc, 3 km s−1) and helps visualise the finer parts of the classical ridges (Sirius, Hyades, Hercules). We note that the ‘hat’ seems to be split in two (which is expected at the OLR from the orbits trapped at the resonance and the linear deformation of velocity space below the resonance). Arcturus also stands out. Bottom left: similar to the top left figure but with a bin size, (ΔR, Δvϕ) = (0.2 kpc, 5 km s−1), that is meant to help low Lz moving groups below Arcturus stand out. These are separated by ∼18−20 km s−1 consistent with the Minchev et al. (2009)’s predictions (Snoop, Chaka, Herbie/K08 with ∼2170, 890 and 530 stars within 4 bins), the series extends further to lower velocities (e.g. ‘Ella’ v ∼ 70 km s−1, ‘Dizzy’ v ∼ 50 km s−1, and even perhaps what we denote ‘Bird’ at ∼30 km s−1). Top right: age moment τ of the vϕ − R plane for the Sanders & Das (2018) catalog. Ridges from Hercules, Sirius and the ‘hat’ (OLR) appear strongly. low Lz moving groups (Arcturus, Snoop, Chaka, Herbie, Ella) also show up as slightly younger patches. We caution against interpreting those absolute ages as a function of radius, as selection effects might be important. What is more useful is to compare ages as a function of velocities at a fixed radius. Bottom right: differential age (![]() ) distribution in the vϕ − R plane. Low Lz ridges show up as slightly but prominently younger than their surrounding. The ‘hat’ (OLR) shows a prominent signal at radii beyond the Sun (9 < R/kpc < 11). Sirius is present across the whole range (7 < R/kpc < 11), and Hercules is particularly strong at radii smaller than R0 with an extension out to 9.5 kpc.
) distribution in the vϕ − R plane. Low Lz ridges show up as slightly but prominently younger than their surrounding. The ‘hat’ (OLR) shows a prominent signal at radii beyond the Sun (9 < R/kpc < 11). Sirius is present across the whole range (7 < R/kpc < 11), and Hercules is particularly strong at radii smaller than R0 with an extension out to 9.5 kpc.
Current usage metrics show cumulative count of Article Views (full-text article views including HTML views, PDF and ePub downloads, according to the available data) and Abstracts Views on Vision4Press platform.
Data correspond to usage on the plateform after 2015. The current usage metrics is available 48-96 hours after online publication and is updated daily on week days.
Initial download of the metrics may take a while.