Fig. 8.
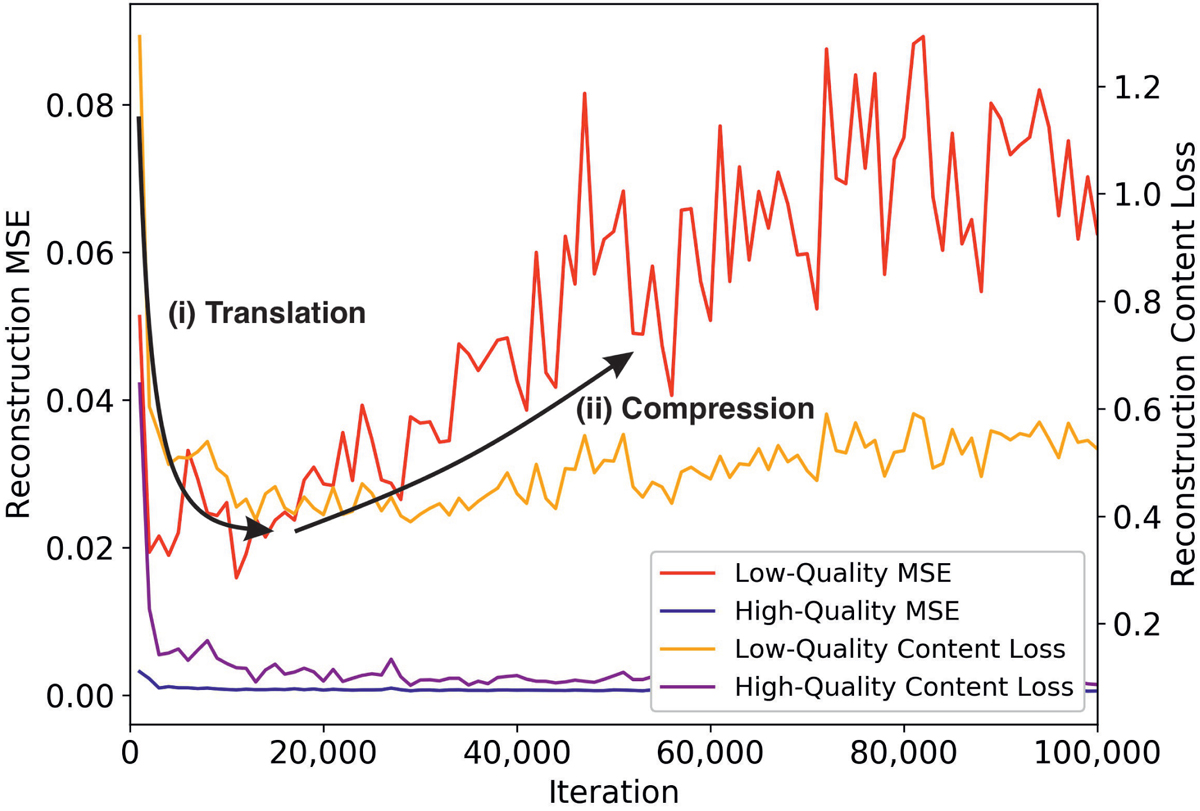
Evaluation of the validation set during the training progress. From both quality metrics (MSE and content loss), two distinct phases can be identified. The orange and red lines denote the reconstruction performance of the low-quality distribution, while the blue and purple lines are the reconstruction losses of the high-quality distribution.
Current usage metrics show cumulative count of Article Views (full-text article views including HTML views, PDF and ePub downloads, according to the available data) and Abstracts Views on Vision4Press platform.
Data correspond to usage on the plateform after 2015. The current usage metrics is available 48-96 hours after online publication and is updated daily on week days.
Initial download of the metrics may take a while.