Fig. 7.
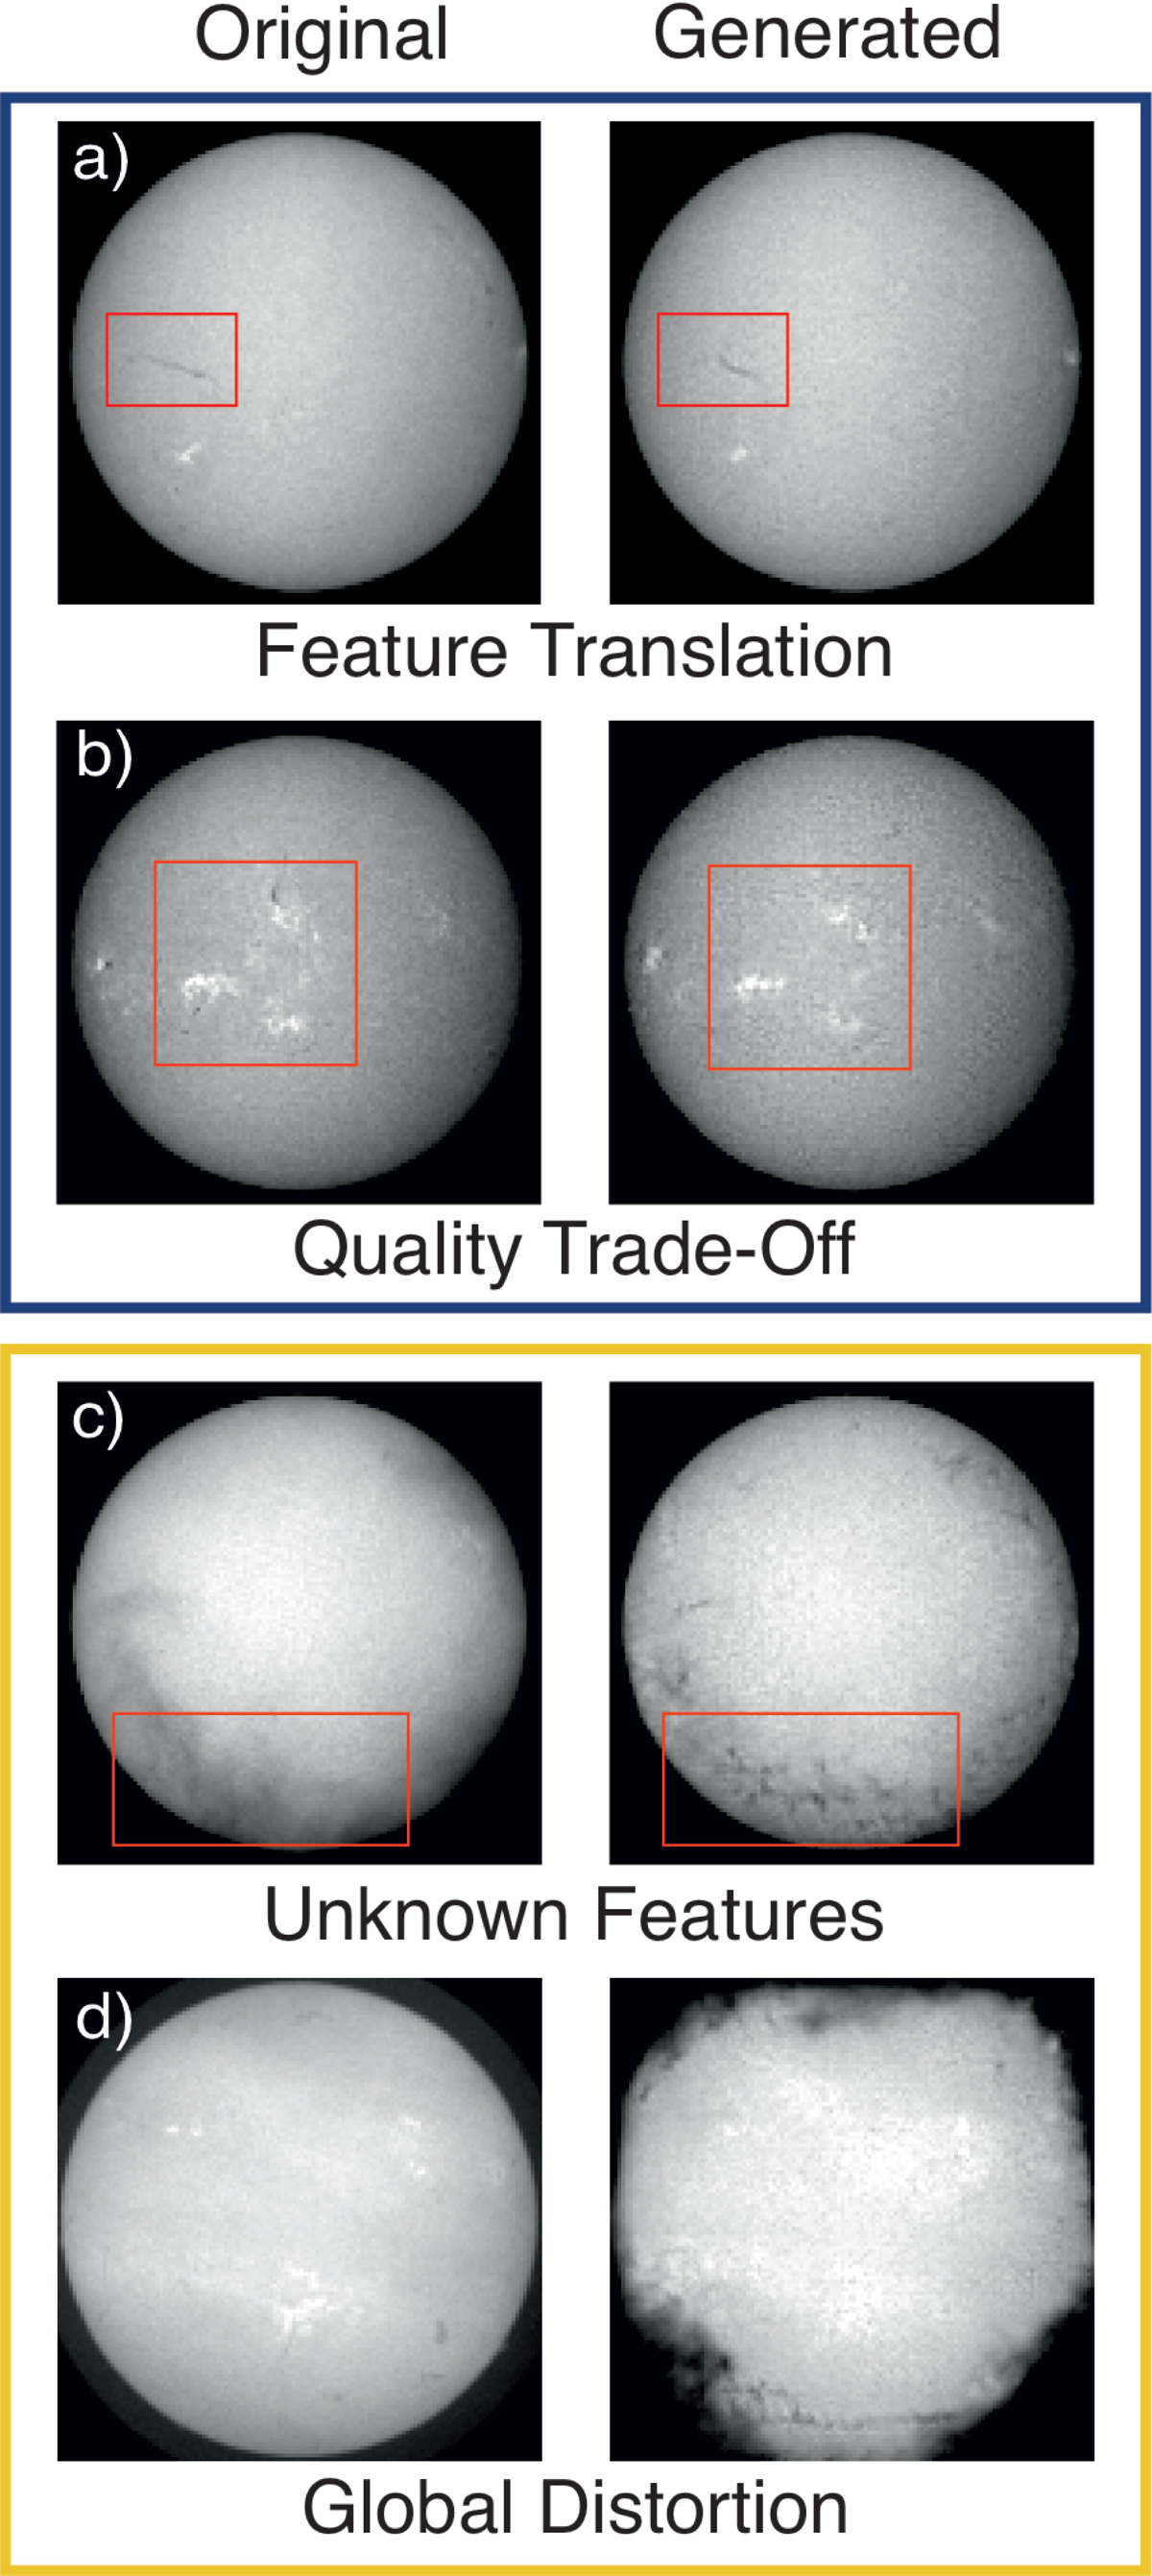
Pairs of original Hα filtergrams (left) as provided to the model and the resulting reconstruction (right). Top panel: samples of the high-quality distribution, bottom panel: samples from the low-quality domain. (a) Illustration of the feature-based image translation. The reconstructed filament can be clearly identified, but shows differences in appearance from the original. (b) Example of the image-quality decrease of a high-quality image due to strong compression. (c) For low-quality images, the unknown features result in artifacts in the reconstruction. (d) Global atmospheric effects show strong differences in the reconstructed image.
Current usage metrics show cumulative count of Article Views (full-text article views including HTML views, PDF and ePub downloads, according to the available data) and Abstracts Views on Vision4Press platform.
Data correspond to usage on the plateform after 2015. The current usage metrics is available 48-96 hours after online publication and is updated daily on week days.
Initial download of the metrics may take a while.