Fig. 5.
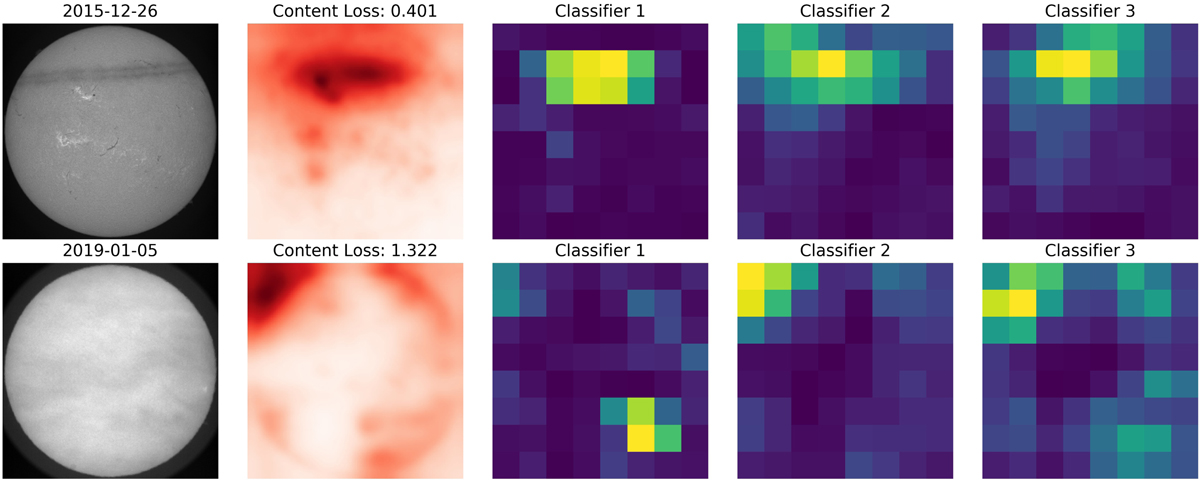
Two examples of the region identification based on the content loss. Column 1: input image. Columns 3–5: absolute differences between the feature activation of the original and reconstructed image for the three classifiers. The feature maps shown were taken at a resolution of 8 × 8 pixels. Column 2: averaged difference over all feature maps and corresponding value of the content loss.
Current usage metrics show cumulative count of Article Views (full-text article views including HTML views, PDF and ePub downloads, according to the available data) and Abstracts Views on Vision4Press platform.
Data correspond to usage on the plateform after 2015. The current usage metrics is available 48-96 hours after online publication and is updated daily on week days.
Initial download of the metrics may take a while.