Fig. 3.
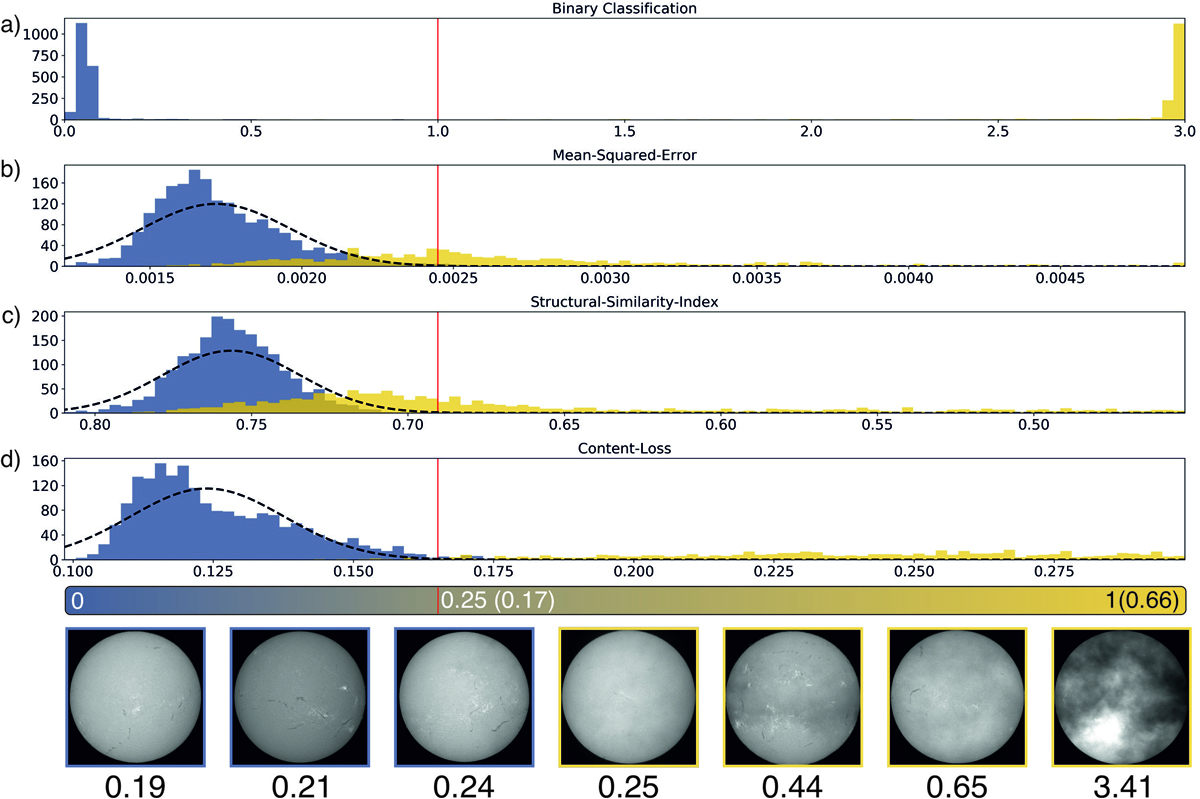
Evaluation of the test set for our CLASS-q8-CONTR model. High-quality and low-quality samples are shown in blue and yellow, respectively. (a) Distribution of the classifier predictions, (b–d) IQMs between the original and reconstructed image in terms of (b) MSE, (c) SSIM and (d) content loss. The normal distribution (dashed black lines) of the high-quality images as well as the low-quality threshold (red line) are indicated for each metric. Samples of decreasing quality as evaluated by our metric and their corresponding content loss are shown in the bottom panels. The image outline is set according to the classifier prediction. An animation of the full test set with increasing image quality is available online (Movie 1).
Current usage metrics show cumulative count of Article Views (full-text article views including HTML views, PDF and ePub downloads, according to the available data) and Abstracts Views on Vision4Press platform.
Data correspond to usage on the plateform after 2015. The current usage metrics is available 48-96 hours after online publication and is updated daily on week days.
Initial download of the metrics may take a while.