Fig. 7.
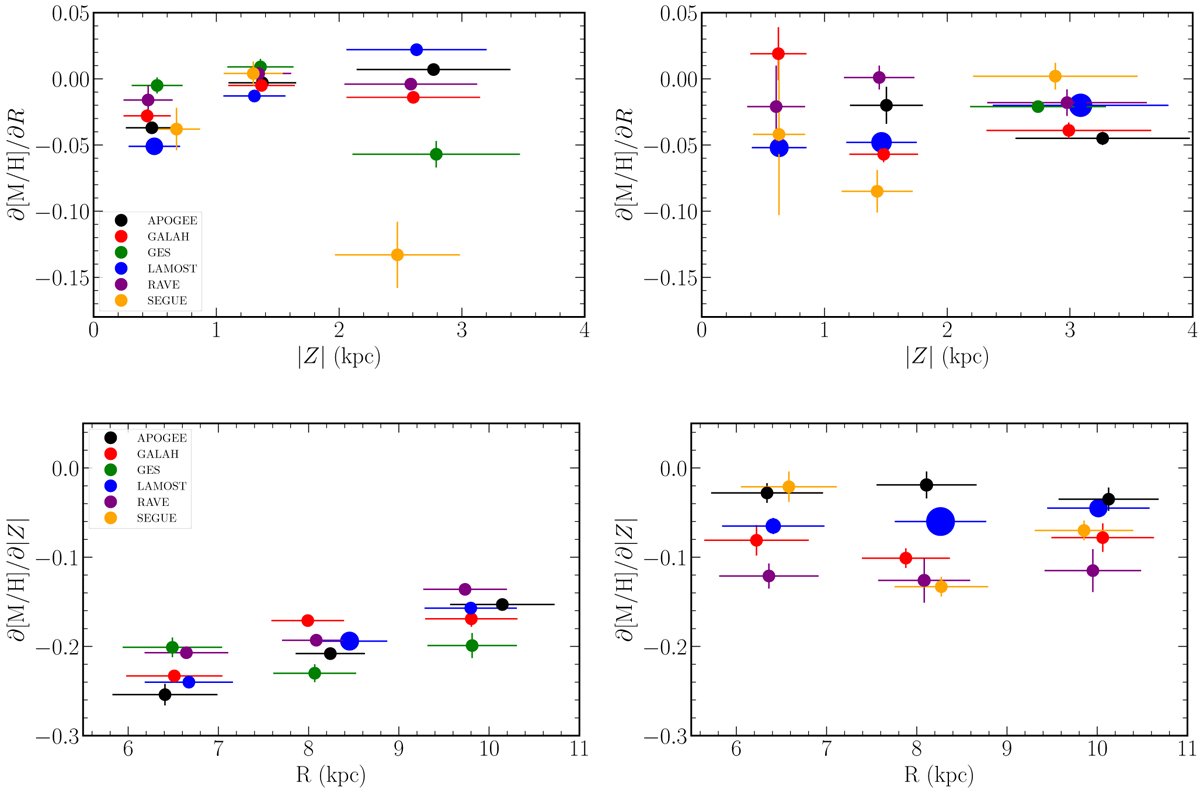
Radial (top) and vertical (bottom) metallicity gradients for the prograde (left) and retrograde (right) samples, split by survey. The vertical error bars correspond to the uncertainty of the fit of the gradient, whereas the horizontal error bar represents the dispersion in |Z| or R, respectively, where the gradient was measured. The size of the dots is a visual aid proportional (within each panel) to the number of stars each survey contains in the considered distance-bin.
Current usage metrics show cumulative count of Article Views (full-text article views including HTML views, PDF and ePub downloads, according to the available data) and Abstracts Views on Vision4Press platform.
Data correspond to usage on the plateform after 2015. The current usage metrics is available 48-96 hours after online publication and is updated daily on week days.
Initial download of the metrics may take a while.