Fig. A.2.
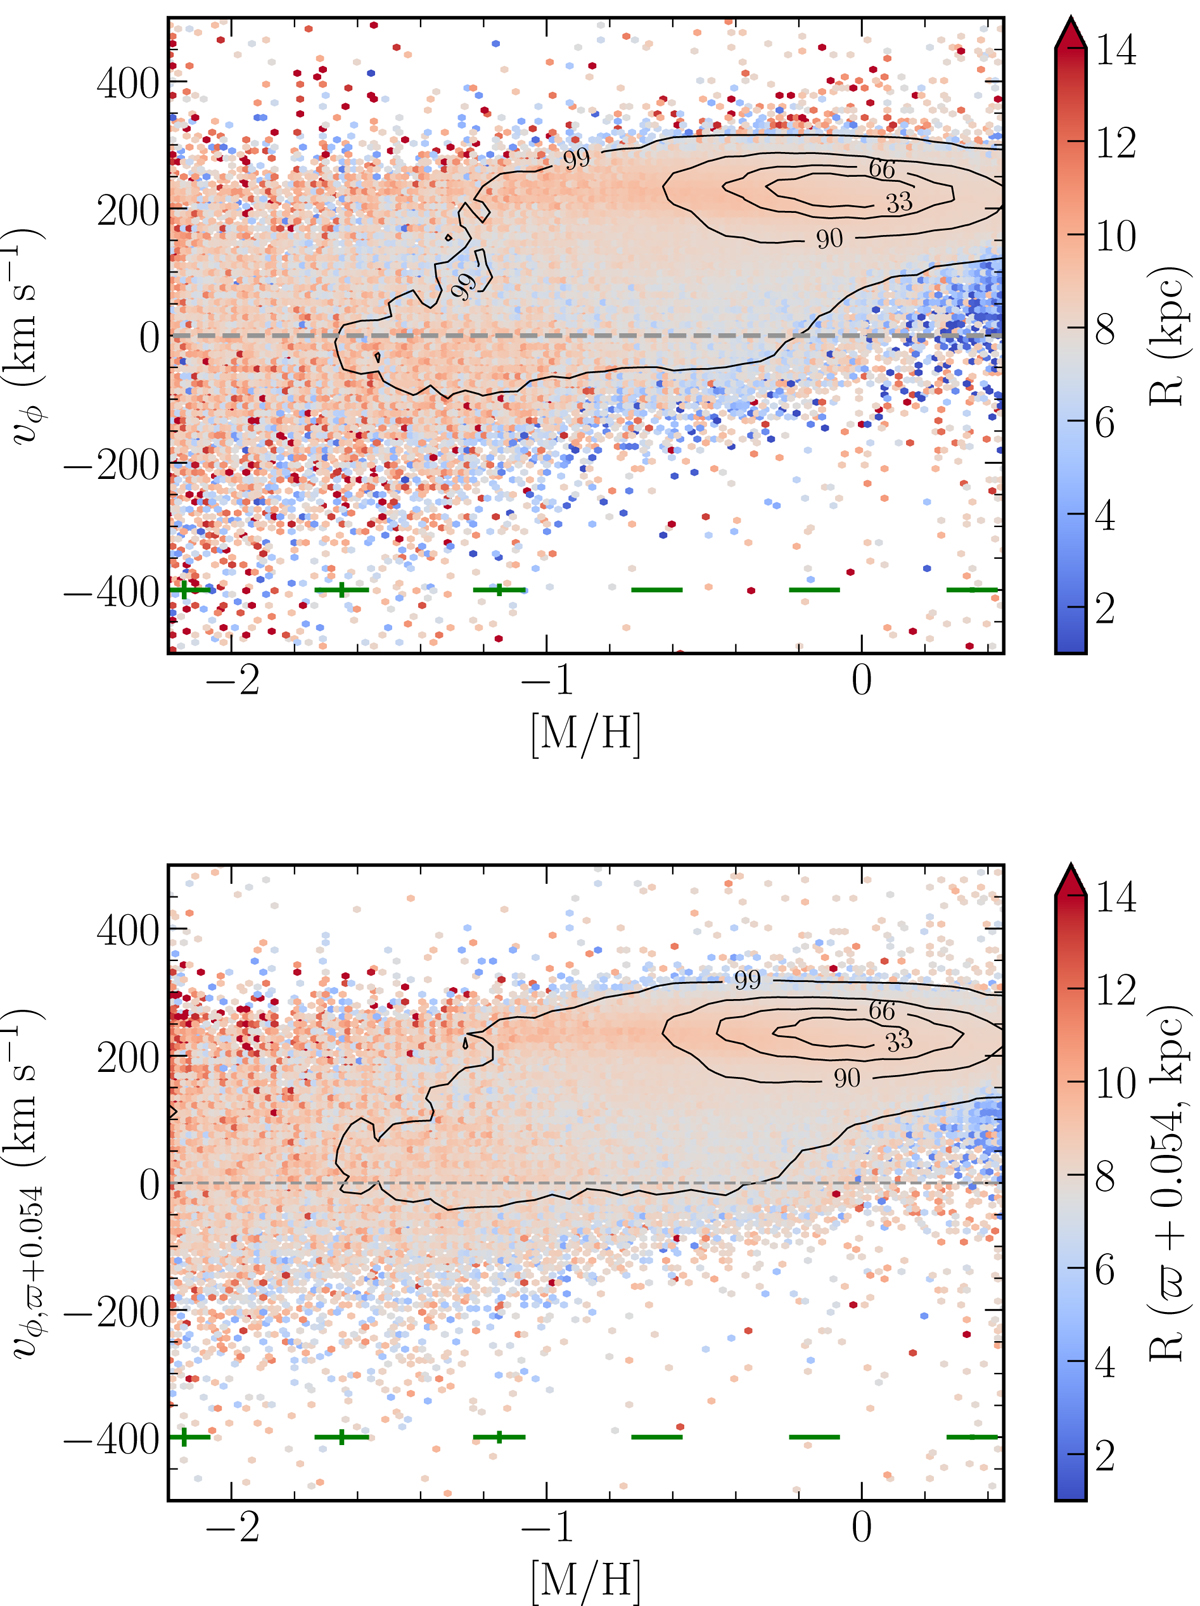
vϕ vs. [M/H] for the all of the stars in our sample, without (top) and with (bottom) a zero-point correction of 0.054 mas on the parallaxes. The uncertainties in vϕ and [M/H] for stars in bins of [M/H] are shown in green at the bottom of the plots. The colour code corresponds to the mean Galactocentric radius of the stars with and without the zero-point correction. Contour lines enclose 33%, 66%, 90%, and 99% of the sample. Dashed grey line denotes the region where vϕ = 0 km s−1.
Current usage metrics show cumulative count of Article Views (full-text article views including HTML views, PDF and ePub downloads, according to the available data) and Abstracts Views on Vision4Press platform.
Data correspond to usage on the plateform after 2015. The current usage metrics is available 48-96 hours after online publication and is updated daily on week days.
Initial download of the metrics may take a while.