Fig. 9.
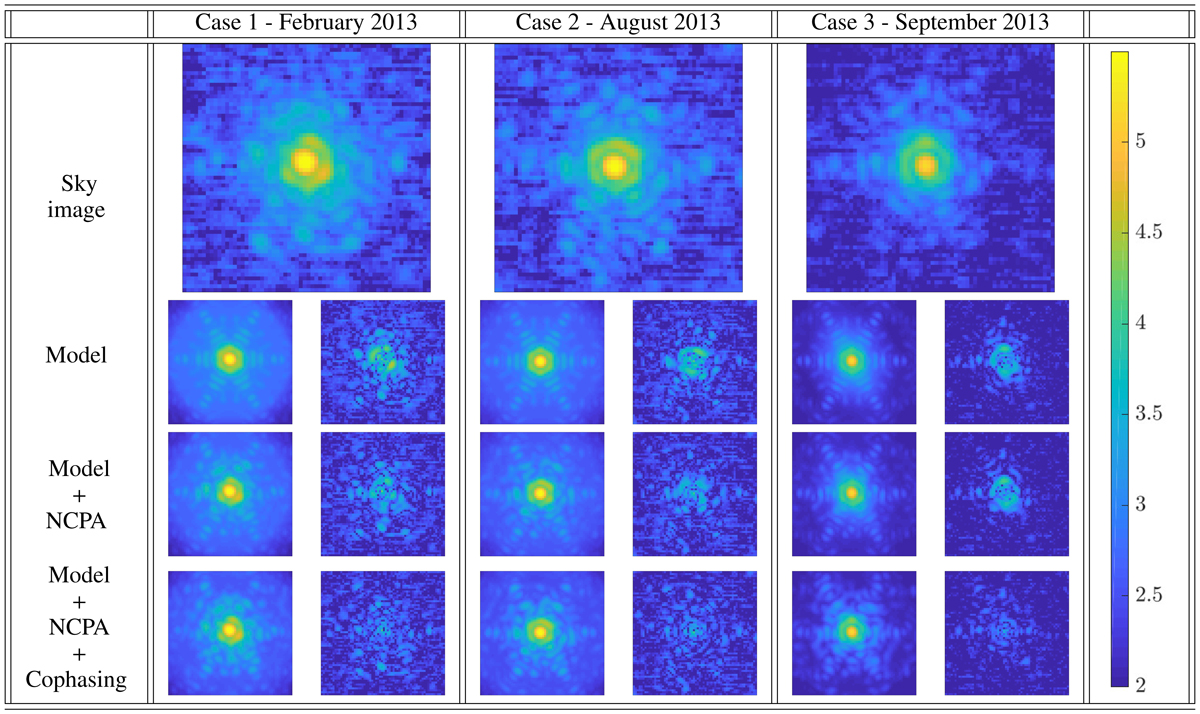
Comparison in log scale of on-sky PSFs and fitted model using the three implemented strategies. Each column correspond to a single data sample acquired at different epochs. For each model configuration, we report both the adjusted PSF and the residual map. This figure illustrates that the cophasing map retrieval improves drastically and consistently the residual on top of the gain brought by including the NCPA residual map.
Current usage metrics show cumulative count of Article Views (full-text article views including HTML views, PDF and ePub downloads, according to the available data) and Abstracts Views on Vision4Press platform.
Data correspond to usage on the plateform after 2015. The current usage metrics is available 48-96 hours after online publication and is updated daily on week days.
Initial download of the metrics may take a while.