Fig. 8.
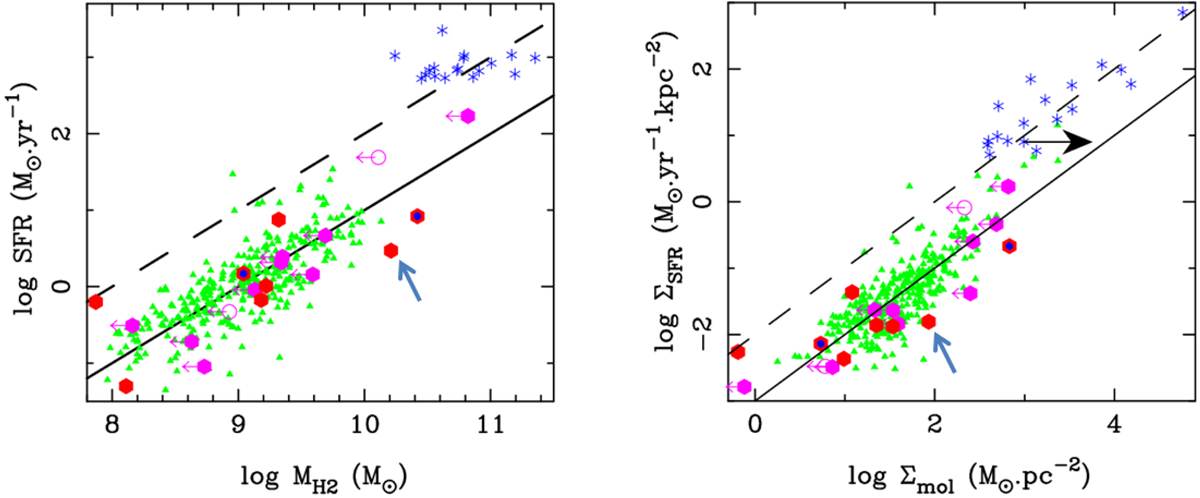
Star formation rate as a function of the molecular content for our targets compared to normal galaxies and starbursts at comparable redshifts. The global SFR-Mmol diagram is shown at the left, and the surface densities of the same quantities, representing the unresolved Kennicutt-Schmidt relation (Kennicutt 1998), are shown at the right. The straight lines are power laws of slope 1. The full line corresponds to a depletion time of 1 Gyr, and the dashed line to 100 Myr. Symbols are the same as in Fig. 7; upper limits of our targets are shown in pink, and tentative detections as a blue hexagon inside the red one. The blue arrow points to the location of R1-1 (GRG-J2345−0449) in the respective plots.
Current usage metrics show cumulative count of Article Views (full-text article views including HTML views, PDF and ePub downloads, according to the available data) and Abstracts Views on Vision4Press platform.
Data correspond to usage on the plateform after 2015. The current usage metrics is available 48-96 hours after online publication and is updated daily on week days.
Initial download of the metrics may take a while.