Fig. 1.
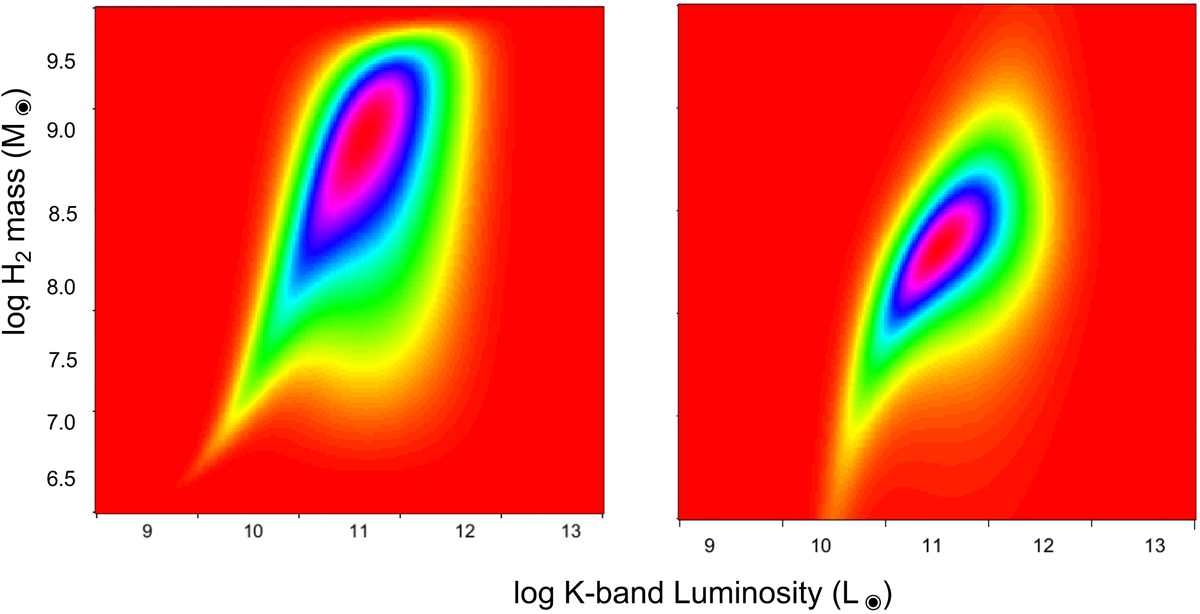
Bivariate functions of the molecular masses and the K-band luminosity, with the molecular mass derived with a luminosity-dependent conversion factor (left) and a constant (right), respectively. The colour code refers to the correlation between the two variables (i.e. larger for those lying in the pink region). The spread is larger for the luminosity-dependent conversion factor. In this latter case, galaxies with a larger K-band luminosity have a lower molecular mass content, while those of a lower K-band luminosity have a large molecular mass content (see text).
Current usage metrics show cumulative count of Article Views (full-text article views including HTML views, PDF and ePub downloads, according to the available data) and Abstracts Views on Vision4Press platform.
Data correspond to usage on the plateform after 2015. The current usage metrics is available 48-96 hours after online publication and is updated daily on week days.
Initial download of the metrics may take a while.