Fig. 9.
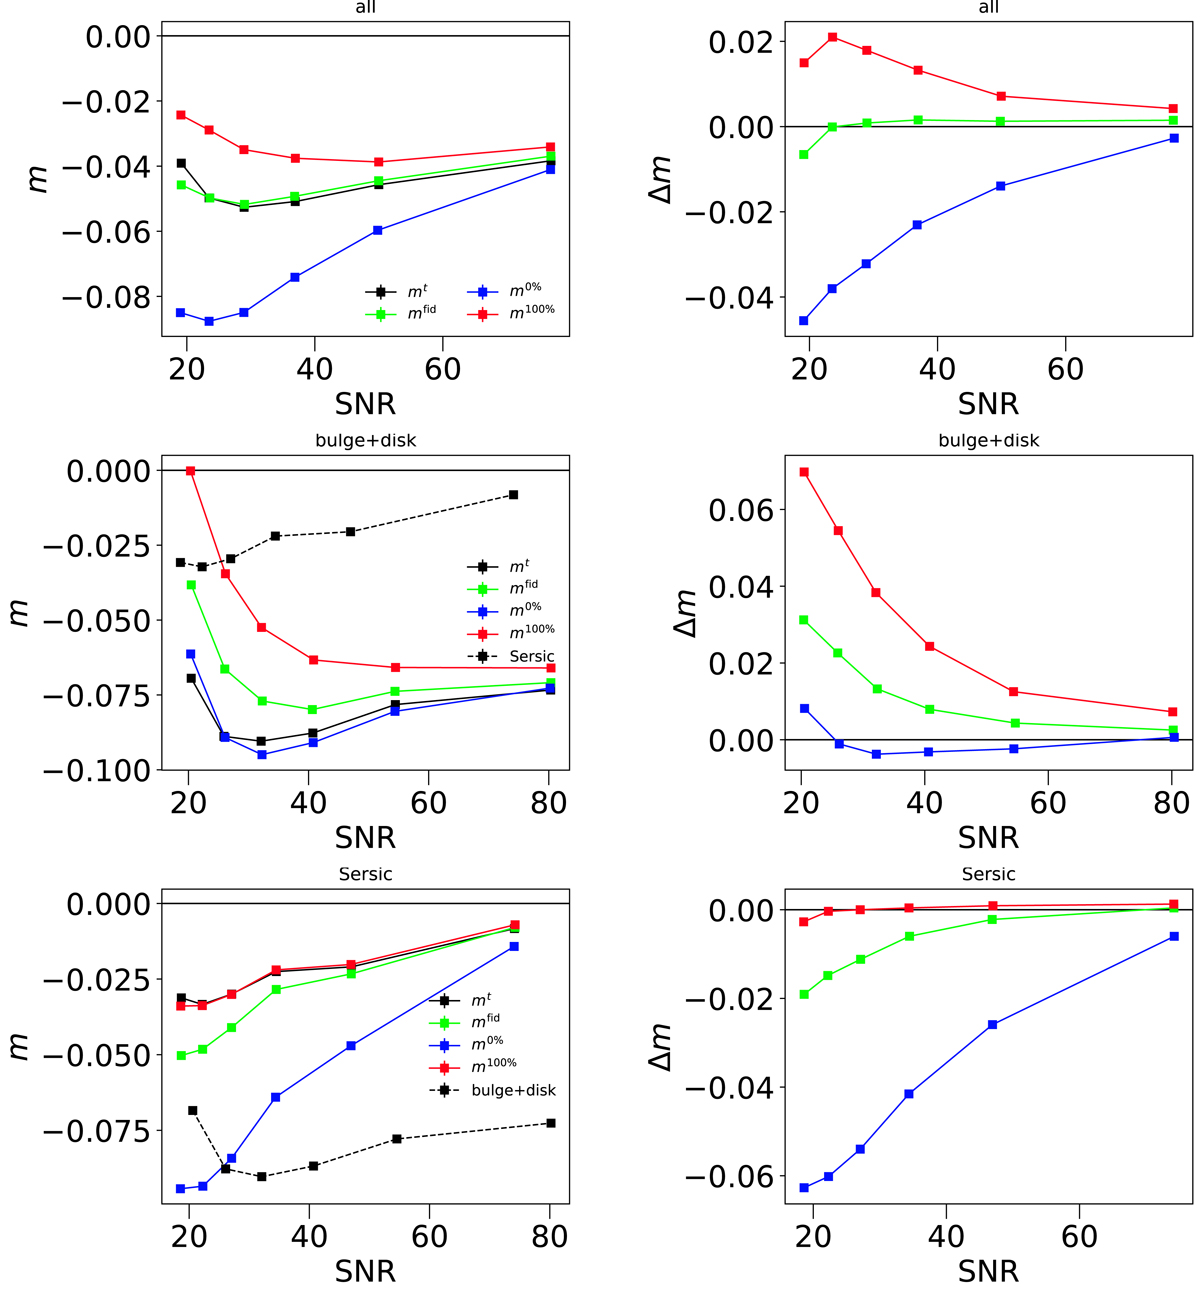
Shear bias predictions using only single Sérsic (in red), only bulge+disc (in blue), or the real population (green) tested on the whole population (top), on only disc+bulge galaxies (middle) and on single Sérsic galaxies (bottom). Solid lines show the true bias of the populations, and the dashed black lines show the shear bias of the excluded population (the true bias for single Sérsic galaxies in the middle panels and for bulge+disc in the bottom panel).
Current usage metrics show cumulative count of Article Views (full-text article views including HTML views, PDF and ePub downloads, according to the available data) and Abstracts Views on Vision4Press platform.
Data correspond to usage on the plateform after 2015. The current usage metrics is available 48-96 hours after online publication and is updated daily on week days.
Initial download of the metrics may take a while.