Open Access
Fig. 7.
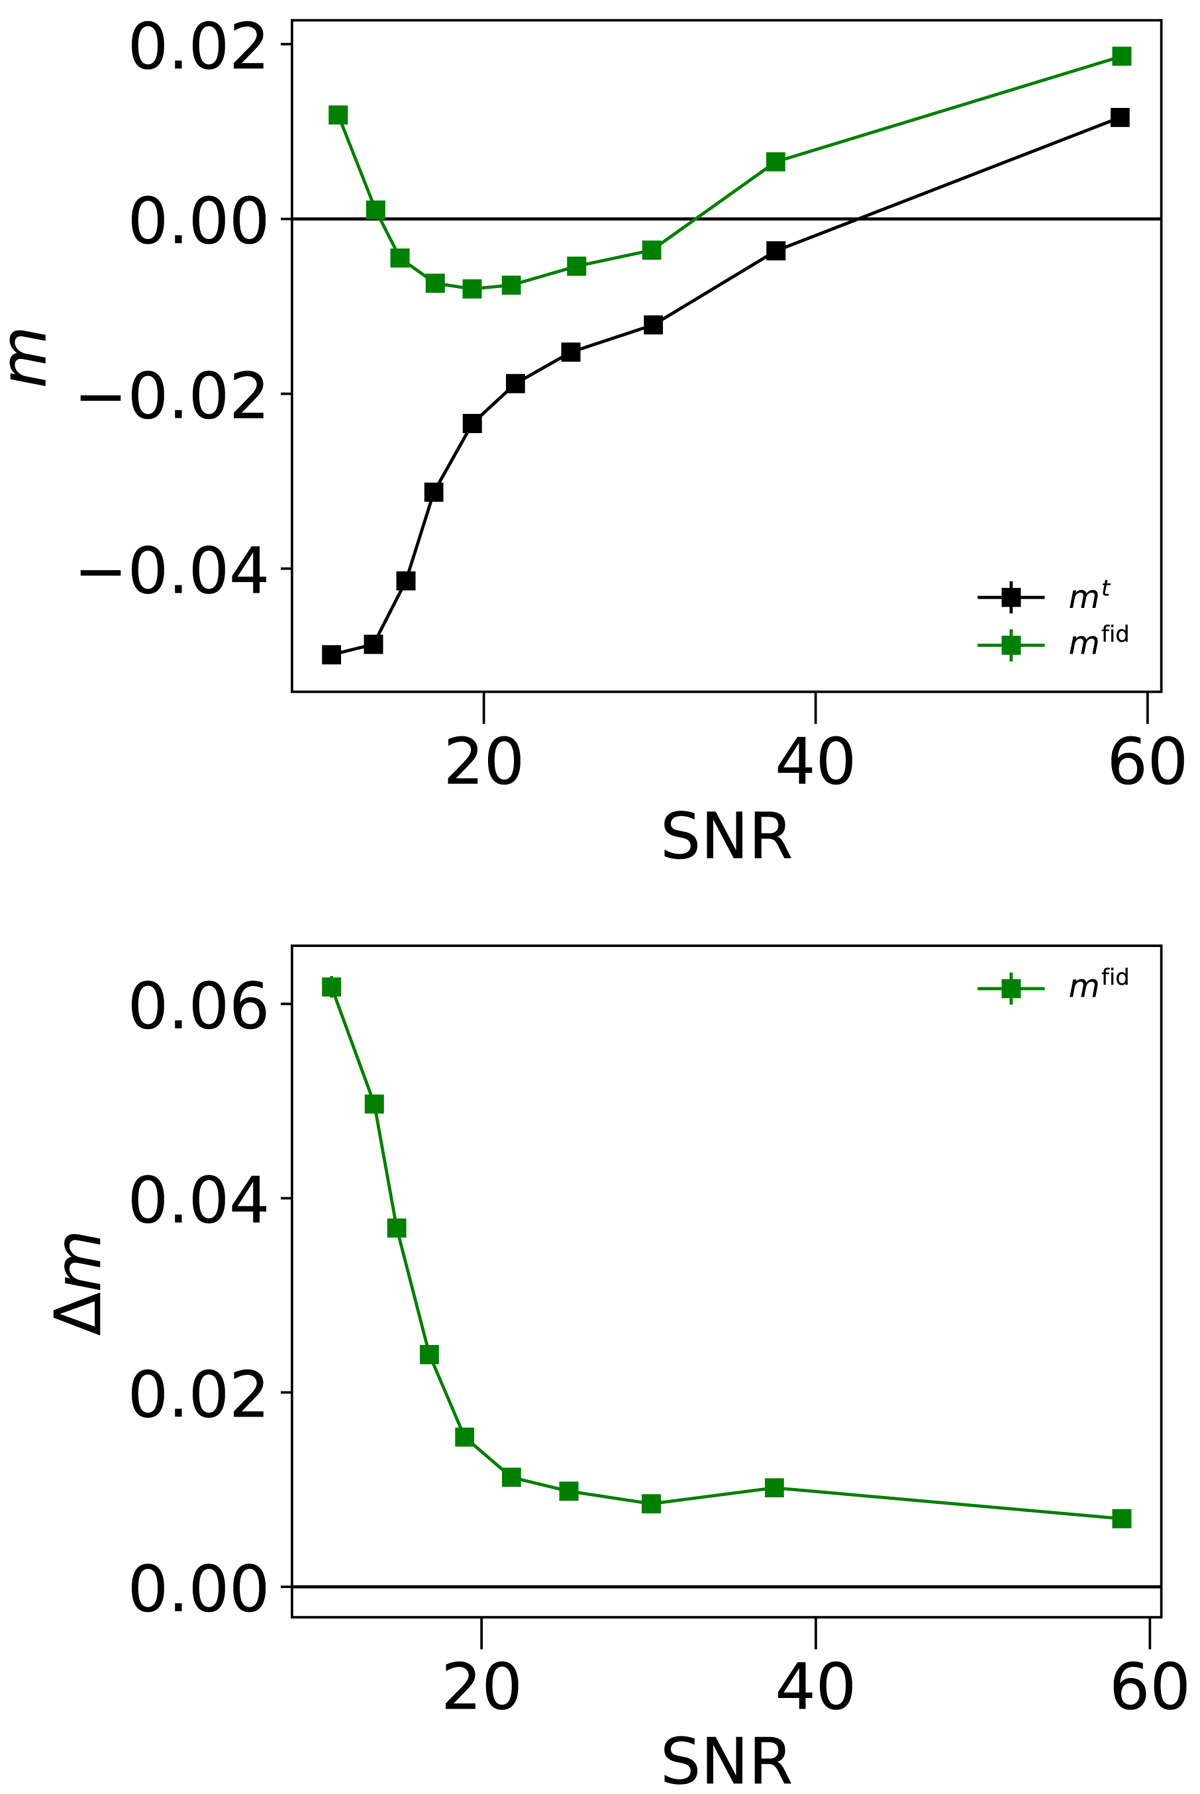
Multiplicative bias predictions for GREAT3-RSC images as a function of S/N. Top panel: bias estimate from NNSC (green line) compared to the true bias (black line). Bottom panel: difference between the estimated and true bias as a function of S/N.
Current usage metrics show cumulative count of Article Views (full-text article views including HTML views, PDF and ePub downloads, according to the available data) and Abstracts Views on Vision4Press platform.
Data correspond to usage on the plateform after 2015. The current usage metrics is available 48-96 hours after online publication and is updated daily on week days.
Initial download of the metrics may take a while.