Fig. 6.
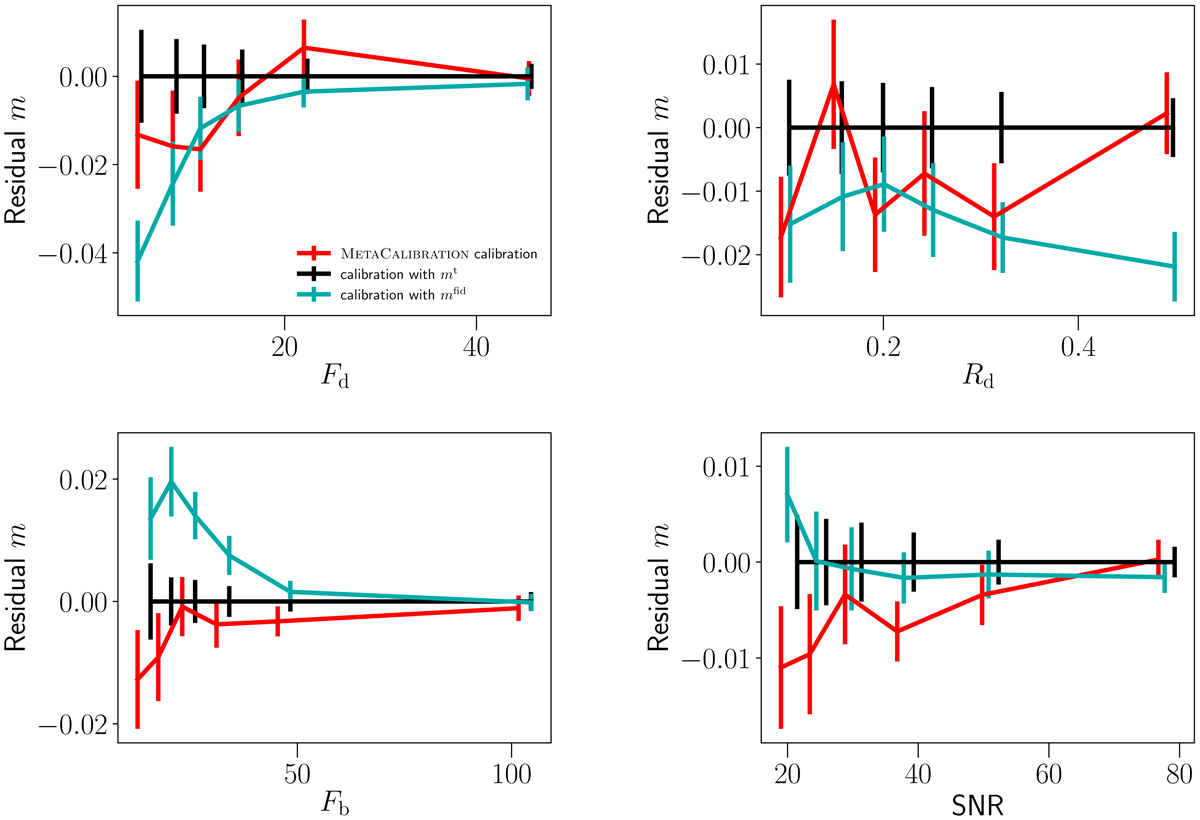
Residual multiplicative shear bias as a function of input galaxy properties: disc flux (top left), disc half-light radius (top right), bulge flux (bottom left), and S/N (bottom right). Red lines show the calibration from METACALIBRATION. The black lines show the calibration using the true bias, and the cyan lines show the calibration using the bias estimate from NNSC.
Current usage metrics show cumulative count of Article Views (full-text article views including HTML views, PDF and ePub downloads, according to the available data) and Abstracts Views on Vision4Press platform.
Data correspond to usage on the plateform after 2015. The current usage metrics is available 48-96 hours after online publication and is updated daily on week days.
Initial download of the metrics may take a while.