Fig. 5.
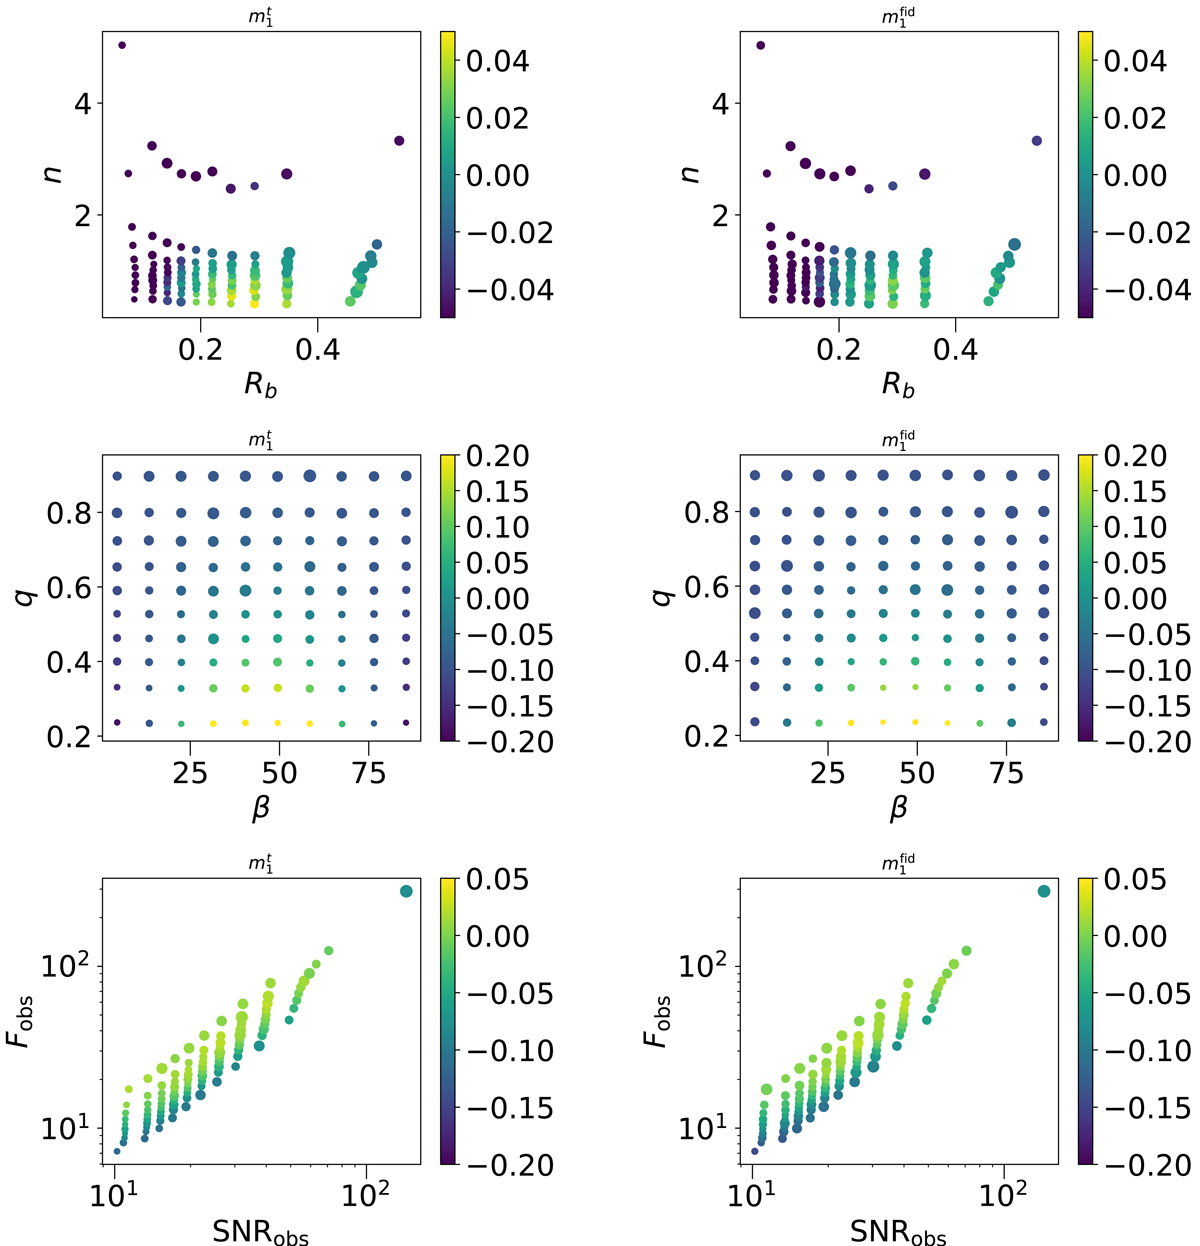
Simultaneous comparison of true (left panels) and estimated (right panels) multiplicative shear bias m1 as a function of two properties. The multiplicative shear bias is represented in colours. Each point is to the mean over an equal number of galaxies, and the point size is inversely proportional to the error bar, so that large points are more significant. Top panels: dependences on Sérsic index n and bulge half-light radius in the simulation. Middle panels: dependences on intrinsic ellipticity modulus q and orientation angle β in the simulation. Bottom panels: dependences on the measured flux and S/N from SEXTRACTOR.
Current usage metrics show cumulative count of Article Views (full-text article views including HTML views, PDF and ePub downloads, according to the available data) and Abstracts Views on Vision4Press platform.
Data correspond to usage on the plateform after 2015. The current usage metrics is available 48-96 hours after online publication and is updated daily on week days.
Initial download of the metrics may take a while.