Fig. A.2.
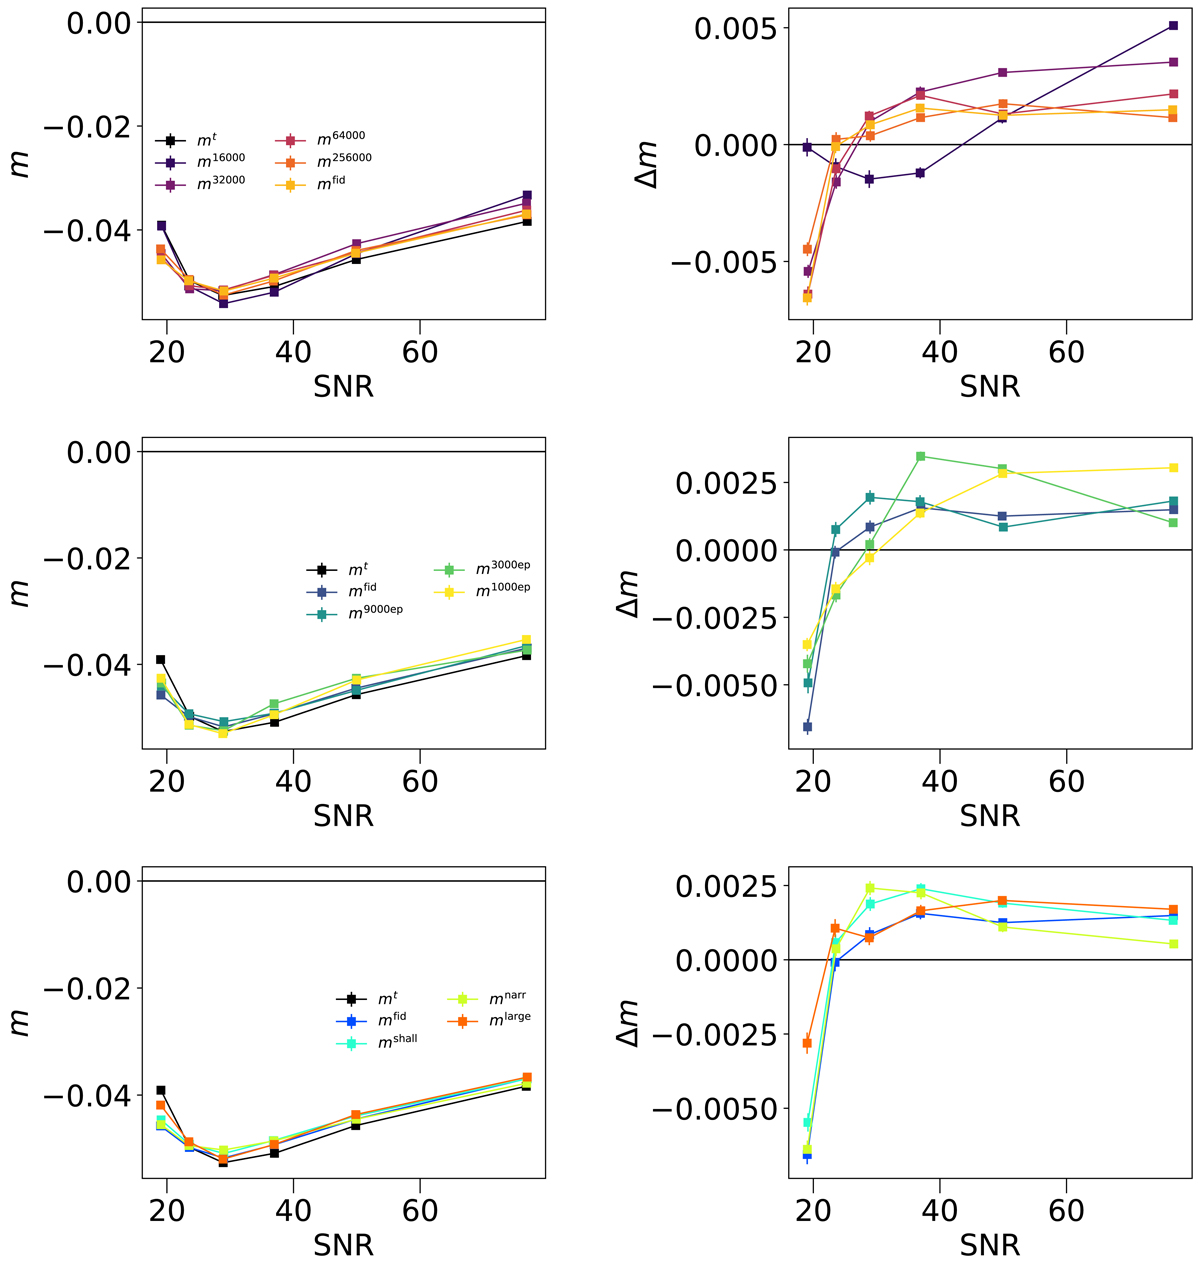
Comparison of estimated multiplicative shear bias m1 (left) and its error Δm1 (right) as a function of S/N for different ML hyper-parameters. Top panels: performance for different numbers of objects used in the training, from 10 000 to 400 000. Middle panels: performances for the chosen architecture for different number of epochs, from 1000 to 9000. Bottom panels: performance for different architectures. The chosen one, shown in blue, corresponds to four hidden layers of 30 nodes each. The shallow architecture, shown in green, has only two hidden layers of 30 nodes. The narrow architecture, shown in orange, corresponds to four hidden layers of 30, 20, 10, and 10 nodes.
Current usage metrics show cumulative count of Article Views (full-text article views including HTML views, PDF and ePub downloads, according to the available data) and Abstracts Views on Vision4Press platform.
Data correspond to usage on the plateform after 2015. The current usage metrics is available 48-96 hours after online publication and is updated daily on week days.
Initial download of the metrics may take a while.