Fig. 8
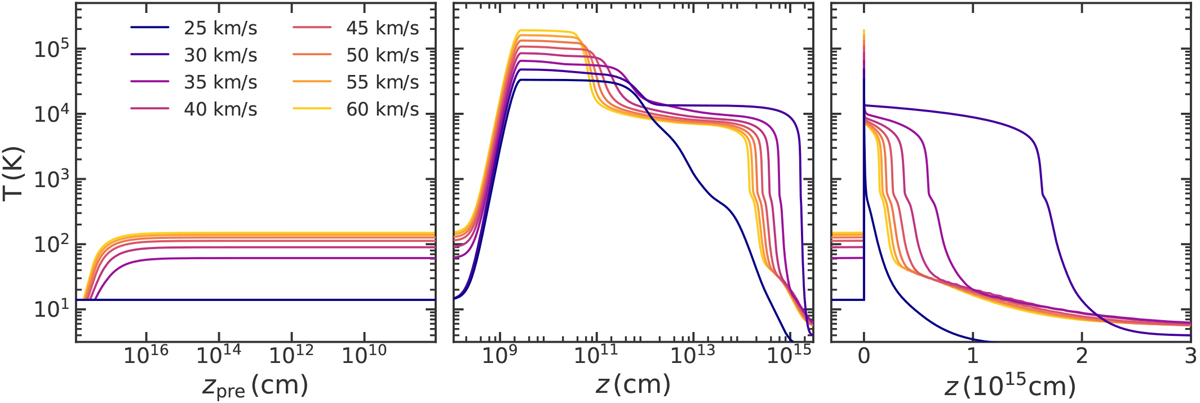
Temperature profiles for the self-consistent shock solutions with shock velocities Vs = 25–60 km s−1 propagating into gas at nH = 104 cm−3. The left shows profiles in the radiative precursor, with distance increasing towards the left (i.e. distance from the shock front), the middle shows postshock profiles with distance increasing towards the right in log scale while the right is the same as the middle but in linear scale. Peak temperatures increase with increasing shock velocity (see Eq. (1)).
Current usage metrics show cumulative count of Article Views (full-text article views including HTML views, PDF and ePub downloads, according to the available data) and Abstracts Views on Vision4Press platform.
Data correspond to usage on the plateform after 2015. The current usage metrics is available 48-96 hours after online publication and is updated daily on week days.
Initial download of the metrics may take a while.