Fig. 6
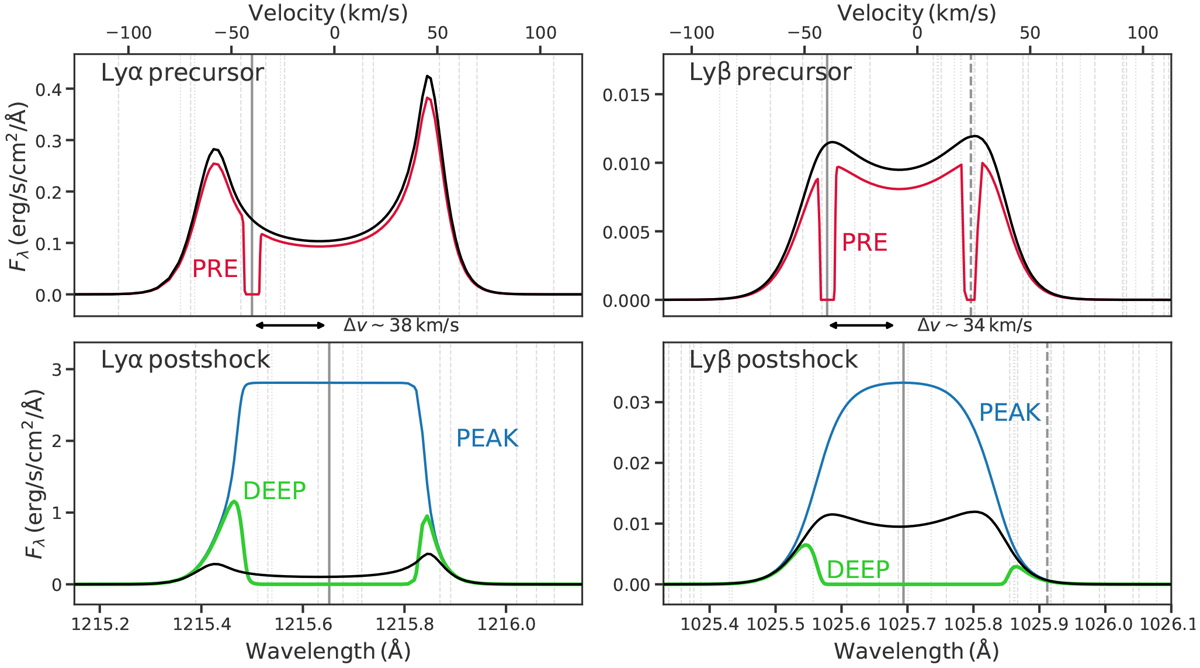
Fluxes of Lyα (left) and Lyβ (right) in precursor (top) and postshock positions (bottom). The positions of the cuts – labelled PRE (red), PEAK (blue) and DEEP (green) – are shown in Fig. 5 by the vertical dashed lines, and the black lines give the fluxes at the shock front z = 0. Vertical greylines show line centres of Lyα and Lyβ (solid), H2 Lyman (dashed) and Werner (dotted) band absorption lines, with an emphasised v = 6 − 0 P(1) H2 line (thick dashed). The precursor vertical lines are Doppler-shifted by the shock velocity, whereas in the postshock panels they are shifted by flow velocity at the peak of the emission, Vz ~ 4 km s−1 for Lyα and Vz ~ 7 km s−1 for Lyβ. The arrows between the top and bottom panels highlights the velocity shift between the preshock gas and at peak emission. We note that none of the y-axes scales are the same.
Current usage metrics show cumulative count of Article Views (full-text article views including HTML views, PDF and ePub downloads, according to the available data) and Abstracts Views on Vision4Press platform.
Data correspond to usage on the plateform after 2015. The current usage metrics is available 48-96 hours after online publication and is updated daily on week days.
Initial download of the metrics may take a while.