Fig. 5
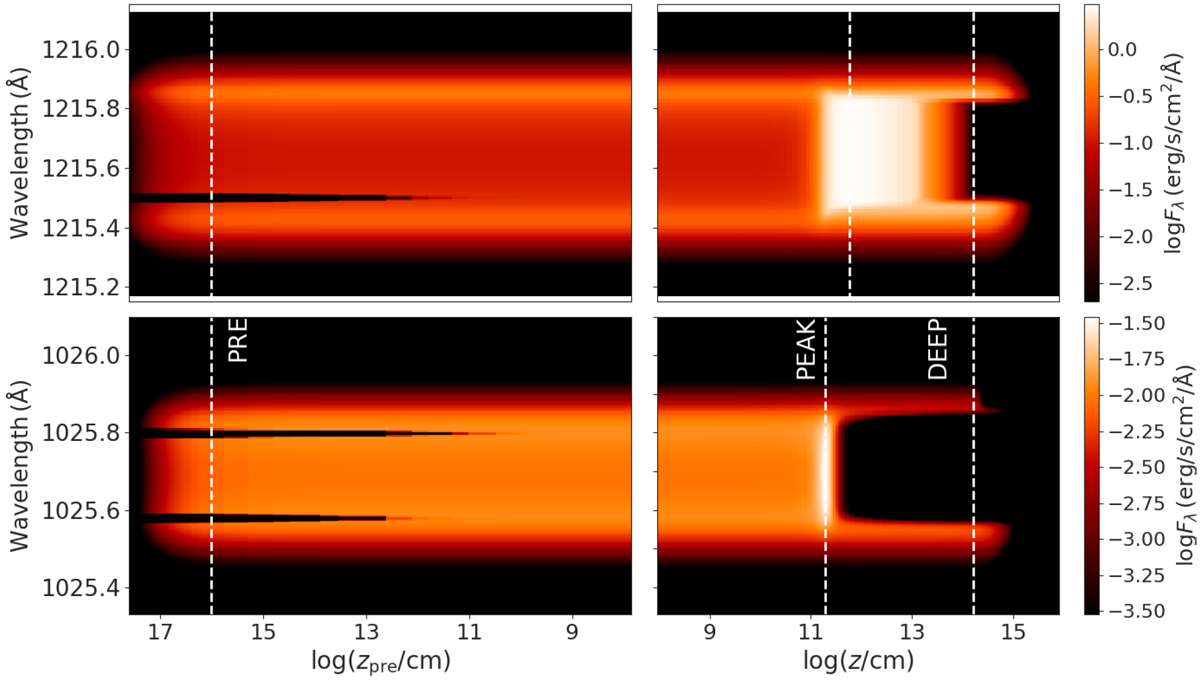
Energy density of Lyα (top) and Lyβ (bottom) emission in the precursor (left) and postshock (right) regions. The vertical dashed lines give the positions of the cuts shown in Fig. 6: (PRE) in the precursor at zpre = 1016 cm, (PEAK) at the peaks of Lyα and Lyβ emission at z ~ 1012 cm and ~ 2 × 1011 cm respectively, and (DEEP) deeper in the postshock at z ~ 1014 cm.
Current usage metrics show cumulative count of Article Views (full-text article views including HTML views, PDF and ePub downloads, according to the available data) and Abstracts Views on Vision4Press platform.
Data correspond to usage on the plateform after 2015. The current usage metrics is available 48-96 hours after online publication and is updated daily on week days.
Initial download of the metrics may take a while.