Open Access
Fig. C.1
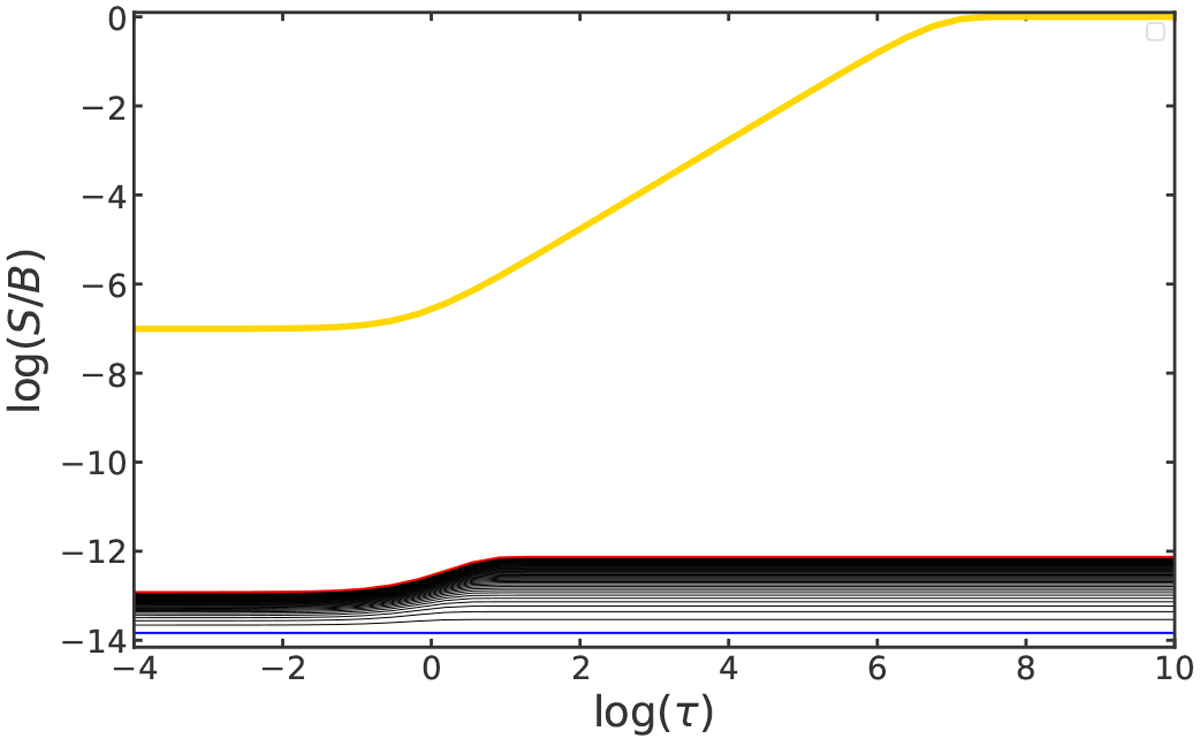
Two-stream approximation test: Lambda Iteration scheme. The yellow line is the analytic solution defined by Eq. (C.1). The blue line is the initial condition and the red line is the solution after 50 iterations.
Current usage metrics show cumulative count of Article Views (full-text article views including HTML views, PDF and ePub downloads, according to the available data) and Abstracts Views on Vision4Press platform.
Data correspond to usage on the plateform after 2015. The current usage metrics is available 48-96 hours after online publication and is updated daily on week days.
Initial download of the metrics may take a while.