Fig. 8
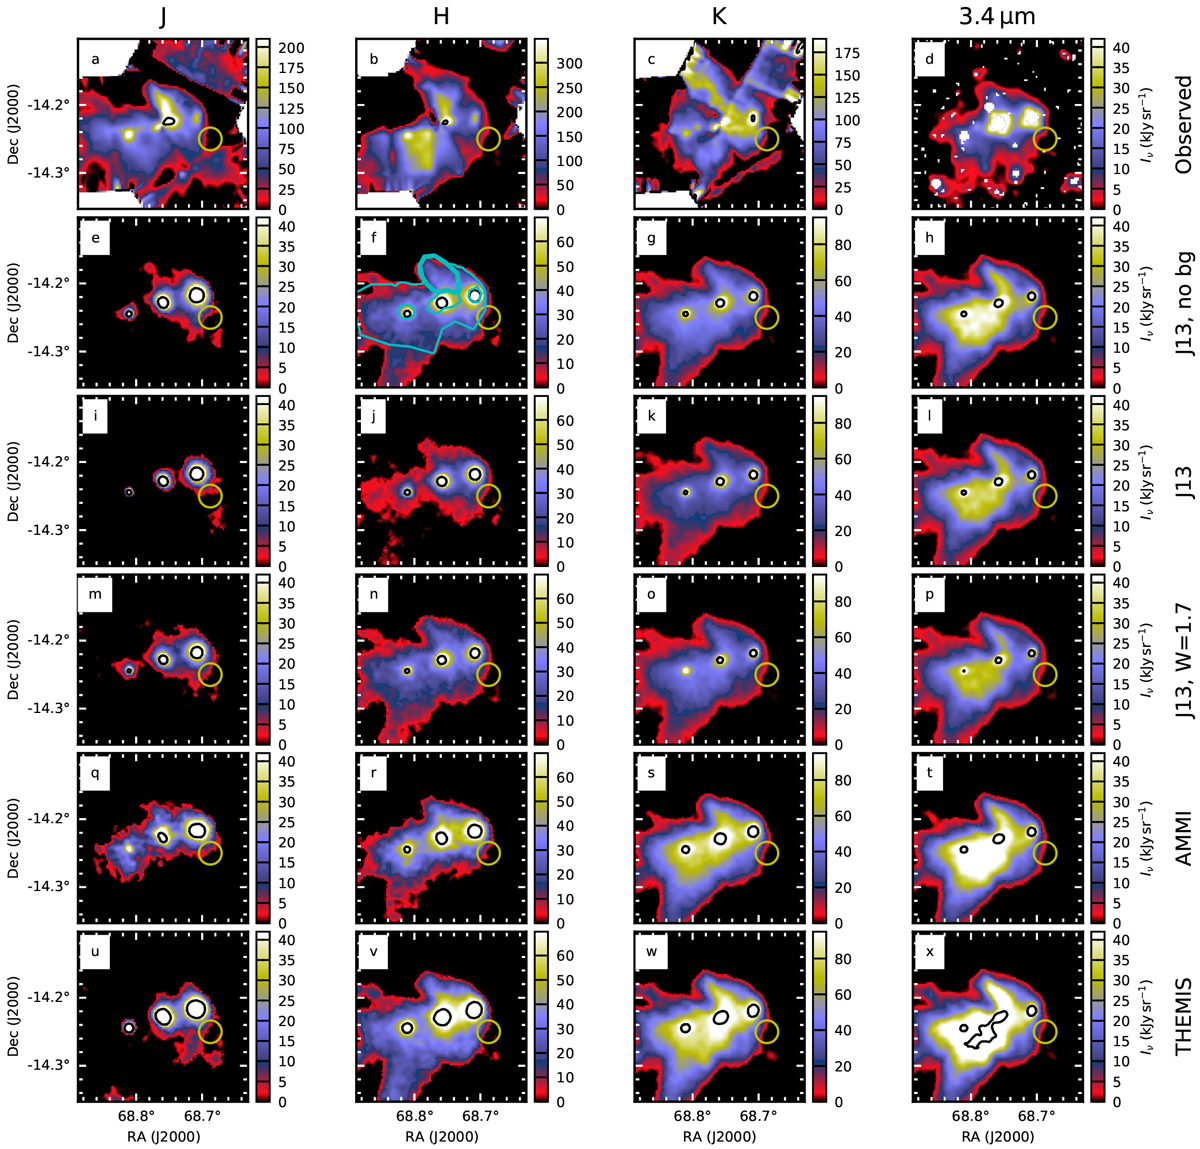
Comparison of observed (first row) and modelled (other rows) 1.25–3.4 μm surface brightness. The second row corresponds to J13 dust, W = 1, and no sky background (Ibg = 0). The effects of sky background are included in the other cases (J13 dust with W = 1 and W = 1.7, and AMMI with W = 1, and the THEMIS model with three dust components). Frame f indicates the areas used for correlation analysis, the larger area shown with a thin cyan line (excluding the sources B1–B3) and the smaller area with a thick cyan line. The yellow circles indicate the reference region used for setting a common zero level. Black contours are drawn at 1.5 times the maximum of the colour scale. The colour scale is the same for all models but different for observations.
Current usage metrics show cumulative count of Article Views (full-text article views including HTML views, PDF and ePub downloads, according to the available data) and Abstracts Views on Vision4Press platform.
Data correspond to usage on the plateform after 2015. The current usage metrics is available 48-96 hours after online publication and is updated daily on week days.
Initial download of the metrics may take a while.